
A data warehouse turns changing data from multiple operational systems into governed historical models that people can query consistently.
A data warehouse is a central analytical system that copies data from operational sources, cleans and reconciles it, preserves useful history, and organizes it for repeatable reporting, business intelligence, and large analytical queries.
Its value is not that all data sits in one expensive box. The value is a controlled route from changing source systems to shared definitions: which order counts as revenue, which date determines the month, how refunds revise history, who may see customer attributes, and whether a dashboard can be reproduced tomorrow.

Start with the problem: four versions of the same revenue number
Imagine a retailer asks, “What was July revenue?” The order system reports $1.24 million based on orders placed. The payment processor reports $1.18 million in captured payments. The finance export reports $1.12 million after refunds and tax treatment. The advertising dashboard attributes $1.31 million to campaigns using its own conversion window.
None of those systems has to be broken. Each records a different business event at a different grain and time:
- an order can be placed, edited, canceled, partially shipped, and refunded;
- a payment can be authorized on one day and captured on another;
- finance may recognize revenue under rules that differ from checkout totals;
- marketing attribution can credit a campaign without defining accounting revenue.
A data warehouse copies the relevant events, retains their source identifiers and timestamps, applies explicit business rules, and produces analytical models such as orders by order date, cash captured by payment date, and recognized net revenue by accounting period. It does not force one number to answer four questions. It makes the definitions and reconciliation visible.
A warehouse complements operational databases
An operational database supports the application doing work now: create an order, update one account, reserve inventory, or record a support reply. These workloads involve frequent small reads and writes with strict consistency and quick response. Running a year-long, multi-table margin analysis against the same database can compete with customers and employees performing those operations.
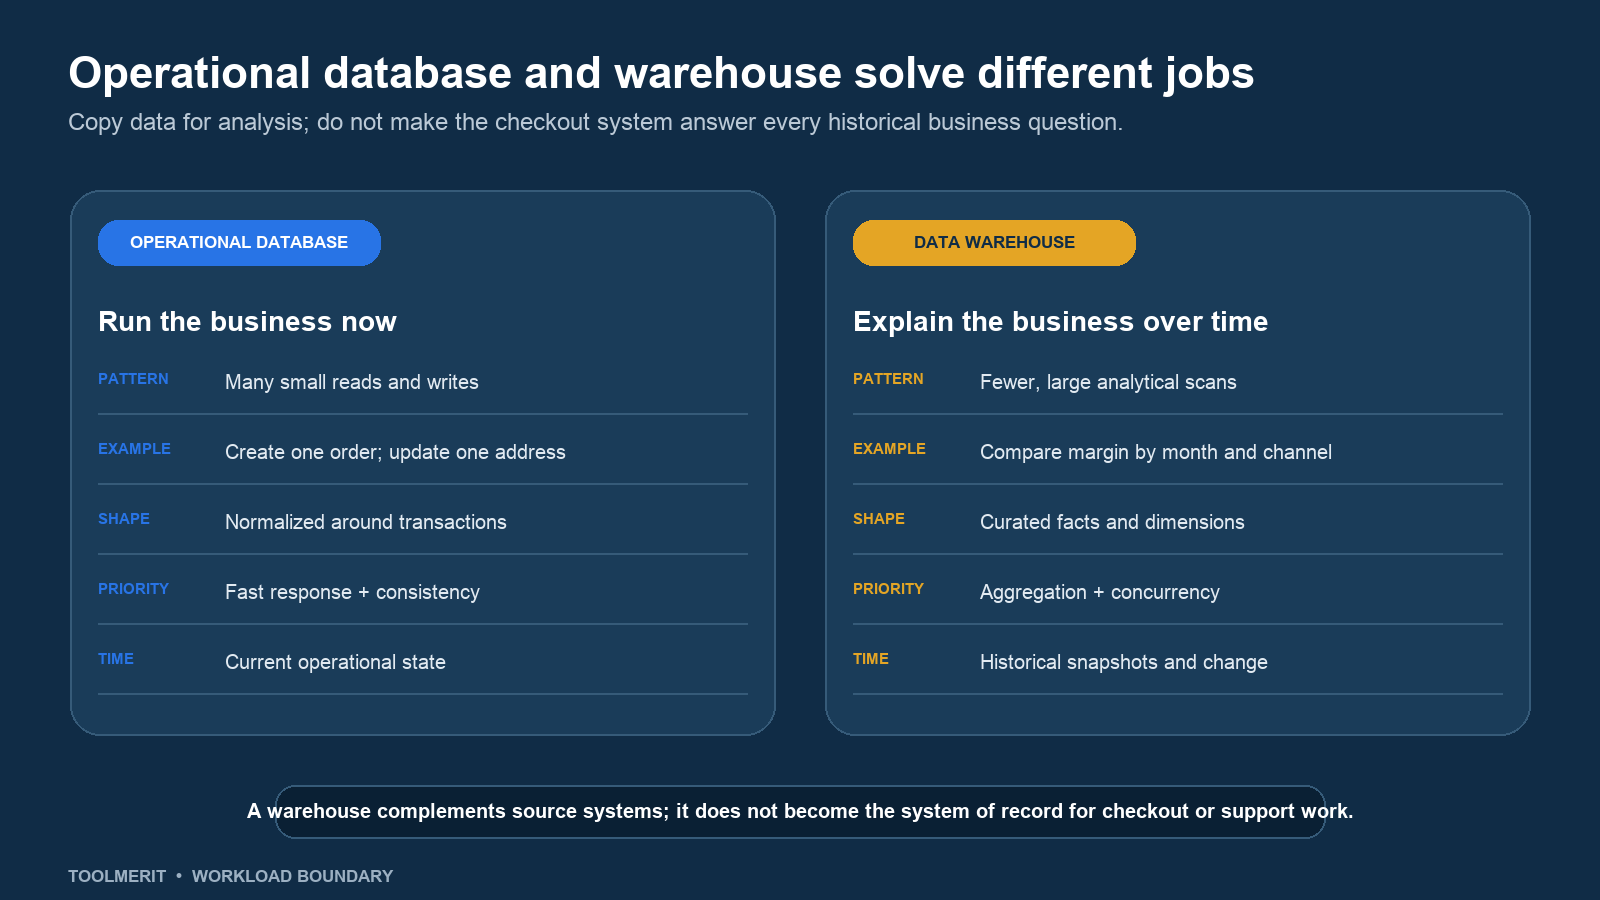
A warehouse is designed for fewer but much larger questions: summarize millions of order lines, compare cohorts over several years, join sales with campaigns and support contacts, or let many analysts query curated data concurrently. Modern implementations commonly use column-oriented storage and distributed or massively parallel query processing. AWS documents those techniques in the Amazon Redshift architecture; Google describes columnar storage and distributed analysis in its BigQuery overview.
The warehouse therefore complements source systems. The checkout database remains the system of record for an active order. The CRM remains where a representative updates an account. The content management system remains where an editor changes a page. The warehouse receives copies or change events and organizes them for analysis; it should not become the interface for operating every business process.
Follow data through the warehouse pipeline
The warehouse tables are only one part of a working system. Microsoft’s current data warehousing architecture shows the broader pattern: multiple sources, staged changes, cleansing and transformation, analytical storage, a semantic layer, and BI consumption. A practical pipeline has five stages.
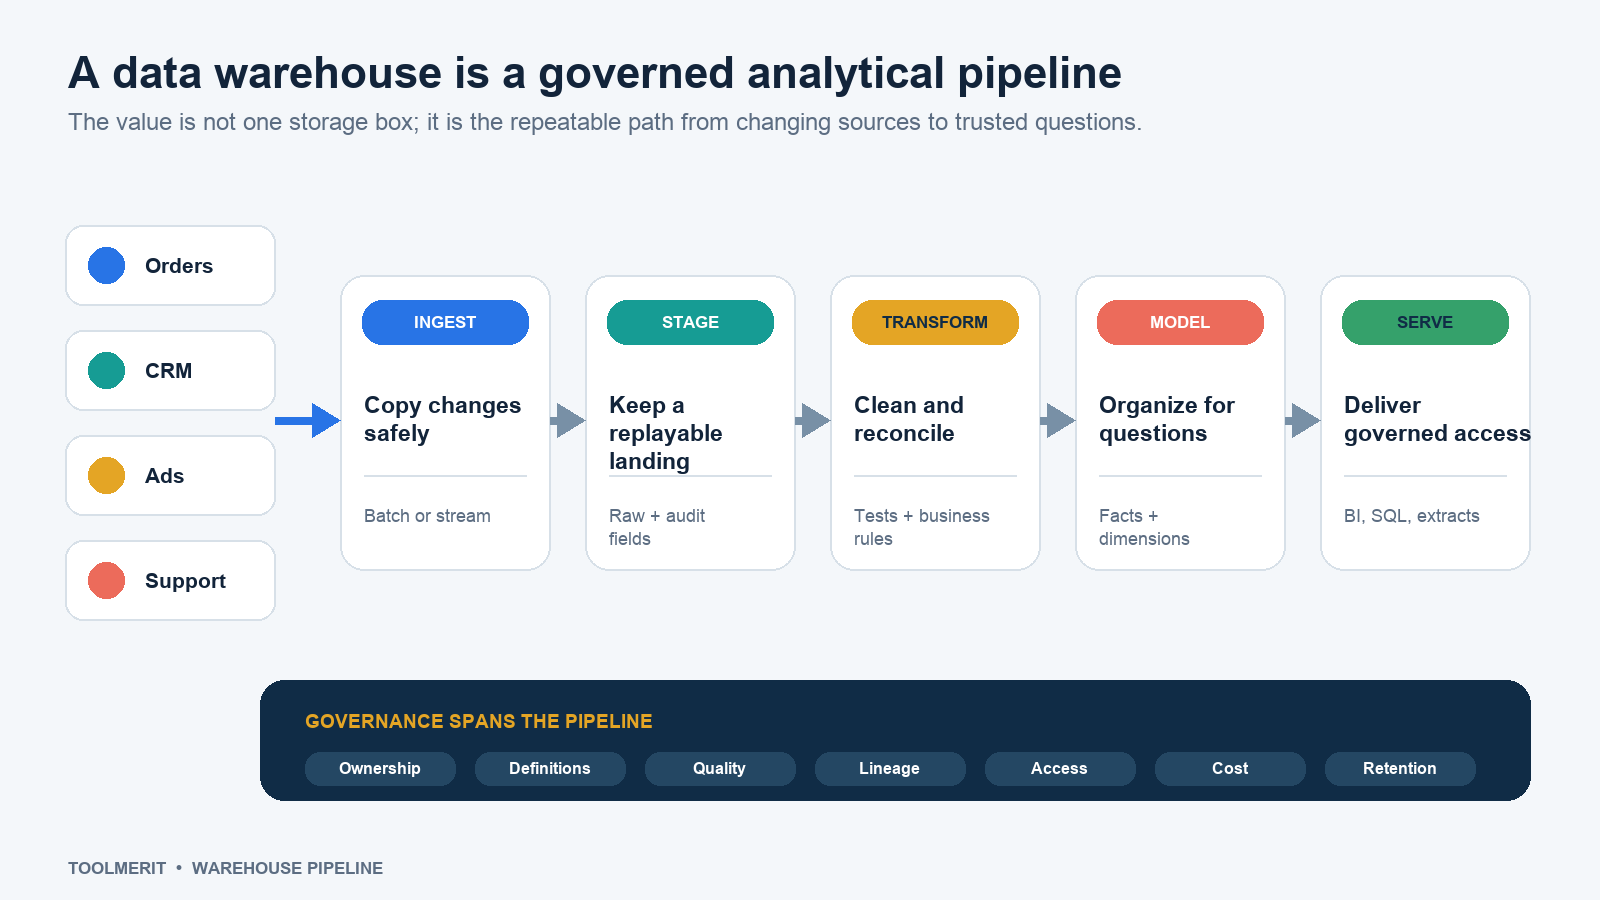
- Ingest: Extract snapshots or capture changes from databases, files, software APIs, event streams, and partner feeds. Preserve source keys and extraction times so a load can be traced.
- Stage: Land data in a replayable area before destructive transformation. A raw copy helps recover from a faulty rule or late-arriving source instead of silently losing the original event.
- Transform: Standardize currencies, timestamps, identifiers, categories, and missing values; deduplicate events; resolve cross-system keys; and apply business logic. Tests should reject or quarantine malformed records rather than hide them.
- Model: Organize curated data around analytical questions and a declared grain. Examples include one row per order line, one row per customer per day, or one monthly target per product.
- Serve: Give BI tools, analysts, data applications, approved extracts, and sometimes machine-learning workflows controlled access to stable tables, views, metrics, or semantic models.
Governance crosses every stage. Assign an owner to each source and metric, document lineage, limit sensitive columns, record quality checks, monitor freshness, control cost, and apply retention rules. A beautiful dashboard cannot repair an unowned source or an undocumented definition.
Model facts, dimensions, grain, and history
Many relational warehouses use dimensional models because they make common business questions easier to express. A fact table stores events or observations such as order lines, payments, inventory snapshots, or support contacts. A dimension table describes the people, products, places, channels, and dates used to filter and group those facts.
For the revenue example, a sales fact could contain quantity, item revenue, discount, cost, customer key, product key, channel key, and order-date key. Product, customer, channel, and date dimensions provide descriptive context. Microsoft’s star-schema guidance explains the division: dimensions support filtering and grouping, while facts support summarization.
The most important modeling decision is often the grain: exactly what one row represents. “Sales data” is not a grain. “One fulfilled order line at the time fulfillment was posted” is. Mixing order totals, line items, and monthly targets in one table can double-count results even when every SQL statement is syntactically correct.
History also needs a rule. If a customer moves from Chicago to Seattle, should last year’s sales remain associated with Chicago or follow the customer’s current city? Both answers can be useful. The warehouse must record which history behavior the model implements instead of letting reports make inconsistent guesses.
Distinguish a warehouse from a lake, lakehouse, and data mart
These boundaries are less rigid in modern platforms, so compare responsibilities rather than product labels.
| System | Typical responsibility | Useful when | Main risk |
|---|---|---|---|
| Data warehouse | Curated, governed analytical models optimized for repeatable queries and reporting | Teams need shared historical metrics across structured sources | Rigid models or centralized bottlenecks if ownership and iteration are weak |
| Data lake | Large-scale storage for raw, structured, semistructured, and unstructured data | Exploration, replay, machine learning, and diverse formats matter | A poorly cataloged lake becomes hard to discover, trust, or govern |
| Lakehouse | Warehouse-style management and analytics over lake-oriented storage and open table formats | One platform must support SQL analytics plus broader data science workloads | The name can hide unresolved modeling, quality, and governance work |
| Data mart | A focused analytical model for a department, subject, or use case | A smaller audience needs a governed slice of enterprise data | Independent marts recreate conflicting definitions and duplicated pipelines |
Microsoft’s current data-lake guidance describes lakes as retaining varied raw data with schema-on-read behavior, while warehouses use structured, curated data optimized for analytical queries. It also shows that the two can coexist: a lake may be the upstream landing area for a warehouse. Google likewise documents that BigQuery can analyze stored warehouse data and query some external data where it lives. Product capabilities overlap; the need for trusted definitions does not disappear.
Understand ETL, ELT, freshness, and replay
ETL means extract, transform, then load curated data into the warehouse. ELT means extract, load source data, then transform it using the destination’s compute. Modern systems often mix both. Security filtering may occur before loading, basic standardization may happen during ingestion, and business models may be built after data lands.
The architectural question is not which acronym sounds modern. Ask:
- Can a failed or incorrect transformation be replayed from a known source copy?
- Can the team detect missing, late, duplicated, or schema-changed data?
- Is freshness measured from the source event to the usable model—not merely to the first landing table?
- Can a report value be traced through model, transformation, ingestion, and source?
- Are access rules enforced in extracts and BI tools as well as warehouse tables?
Real-time ingestion is not automatically more accurate. A five-minute feed with undefined refund logic can be less useful than a daily model that reconciles to finance. Set freshness from the business decision: fraud alerts may need seconds, fulfillment operations minutes, executive financial reporting a controlled daily or monthly close.
Decide whether you need a warehouse now
| Observed symptom | Likely need | First action |
|---|---|---|
| Teams manually join exports from several systems every week | Repeatable ingestion, cross-source keys, and tested transformations | Choose one recurring decision and inventory its sources, owners, grain, and refresh need |
| Reports disagree on revenue, customers, or conversion | Explicit metric contracts and reconciliation—not storage alone | Write definitions, dates, inclusions, exclusions, and authoritative comparisons before choosing tables |
| Analytical queries slow a production application | Workload isolation and analytical storage | Measure the queries and copy only the required data into a protected analytical environment |
| Historical changes are overwritten in source systems | Snapshots or change history with retention rules | Define which historical questions matter and capture the required events before they disappear |
| One spreadsheet reliably answers a stable monthly question | Possibly better controls, not a platform migration | Document inputs, ownership, review, and error checks; expand only when scale or risk requires it |
Start with one valuable, disputed, or labor-intensive decision—not “put all company data in one place.” For the retailer, that might be net revenue by accounting period and sales channel. Name the owner, source events, grain, history rule, reconciliation target, refresh agreement, access boundary, and cost limit. Then build the smallest pipeline and model that can answer it reproducibly.
Measure value against the work it replaces or improves: fewer manual hours, fewer contradictory reports, faster decisions, lower load on operational systems, or better detection of exceptions. Our ROI guide provides a consistent way to compare those benefits with engineering, platform, governance, and ongoing support costs.
Use one decision rule for the architecture
You need warehouse capability when recurring analytical questions require governed integration, historical context, workload isolation, and shared definitions across sources. You do not need a warehouse merely because the organization has data, dashboards, or a cloud account.
The decision rule is: centralize the analytical path only after you can name the question, grain, owner, source, definition, freshness, and verification method. If those remain unknown, a larger platform will centralize disagreement. If they are explicit, the warehouse can turn four incompatible revenue numbers into four understood measures—and let the business choose the correct one for each decision.