

Calculate ROI from net value and full cost, test uncertain assumptions, and avoid confusing revenue, ROAS, and time-aware returns.
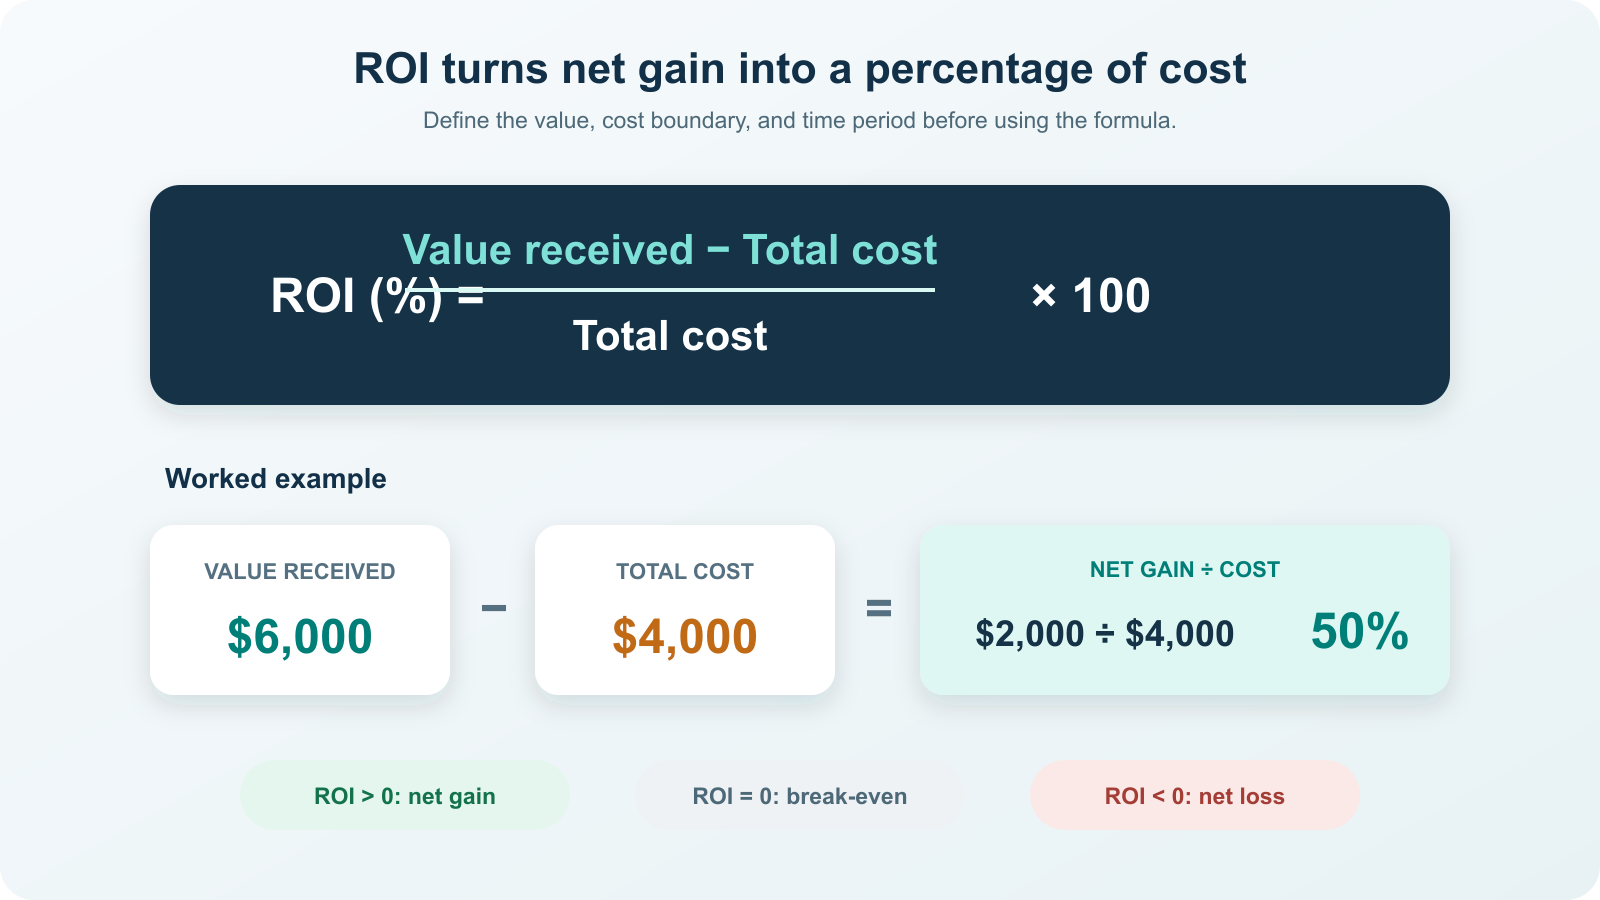
ROI (return on investment) measures a net gain or loss as a percentage of the amount invested. The basic formula is ROI = (value received − total cost) ÷ total cost × 100.
If an investment costs $4,000 and produces $6,000 of measurable value, the net gain is $2,000 and the ROI is 50%. That means $0.50 of net gain for each $1.00 invested—not $0.50 of revenue and not a guarantee that the same return will continue.

Use the ROI formula without changing its meaning
NIST describes the simplest form as ROI (%) = net profit ÷ investment × 100 in its Measurement Science for Sustainable Construction and Manufacturing report. The equivalent expanded form is:
ROI (%) = (value received − total cost) ÷ total cost × 100
“Value received” and “total cost” must use the same scope and time period. For a resale investment, value may include the ending value plus cash distributions. For a business project, it may include incremental contribution profit, cash savings, or monetized capacity. The numerator is the net result after subtracting the denominator’s cost once.
| ROI result | Plain-English interpretation | If total cost is $10,000 |
|---|---|---|
| −100% | The measurable value fell to zero; the entire cost was lost. | $0 value, −$10,000 net result |
| −25% | The value recovered 75% of the cost. | $7,500 value, −$2,500 net result |
| 0% | The measured value exactly equaled the measured cost. | $10,000 value, $0 net result |
| 25% | The net gain was one-quarter of the cost. | $12,500 value, $2,500 net result |
| 100% | The net gain equaled the cost; total value was twice the cost. | $20,000 value, $10,000 net result |
A result below −100% can occur when an investment creates obligations beyond the initial amount, such as debt, penalties, remediation, or continuing losses. Do not assume the original purchase price caps the downside unless the structure actually limits liability.
Write an ROI measurement contract before collecting numbers
The arithmetic is easy to audit; the definitions are where most ROI disagreements begin. Write these five lines before opening a spreadsheet:
| Field | Question to answer | Example for a software purchase |
|---|---|---|
| Decision | What action or investment is being evaluated? | Buy and deploy one automation tool for the operations team. |
| Baseline | What would happen without that action? | Continue the current manual workflow and contractor arrangement. |
| Period | Which dates do both value and cost cover? | First 12 months after production launch. |
| Value rule | Which changes count, and how will they be monetized? | Verified labor hours released at loaded hourly cost plus avoided contractor invoices. |
| Cost boundary | Which cash and internal resource costs belong to the decision? | Subscription, setup, integration, training, internal project time, and ongoing support. |
Label the result as projected ROI when it uses forecasts and realized ROI when it uses observed results. For a decision, the most defensible value is usually incremental: what changed compared with the baseline, not every dollar that happened after launch. If the baseline would have generated $80,000 without the project and the project generated $100,000, the gross result is not automatically a $100,000 benefit.
Build the full cost boundary
The investment is rarely just the price on an invoice. A current digital-investment guide from the UK’s Local Government Association recommends whole-lifecycle costing, including implementation, internal delivery, ongoing support, maintenance, training, and organizational development. Its cost-benefit guidance also uses (benefits − costs) ÷ costs and recommends sensitivity analysis when outcomes depend on uncertain assumptions.
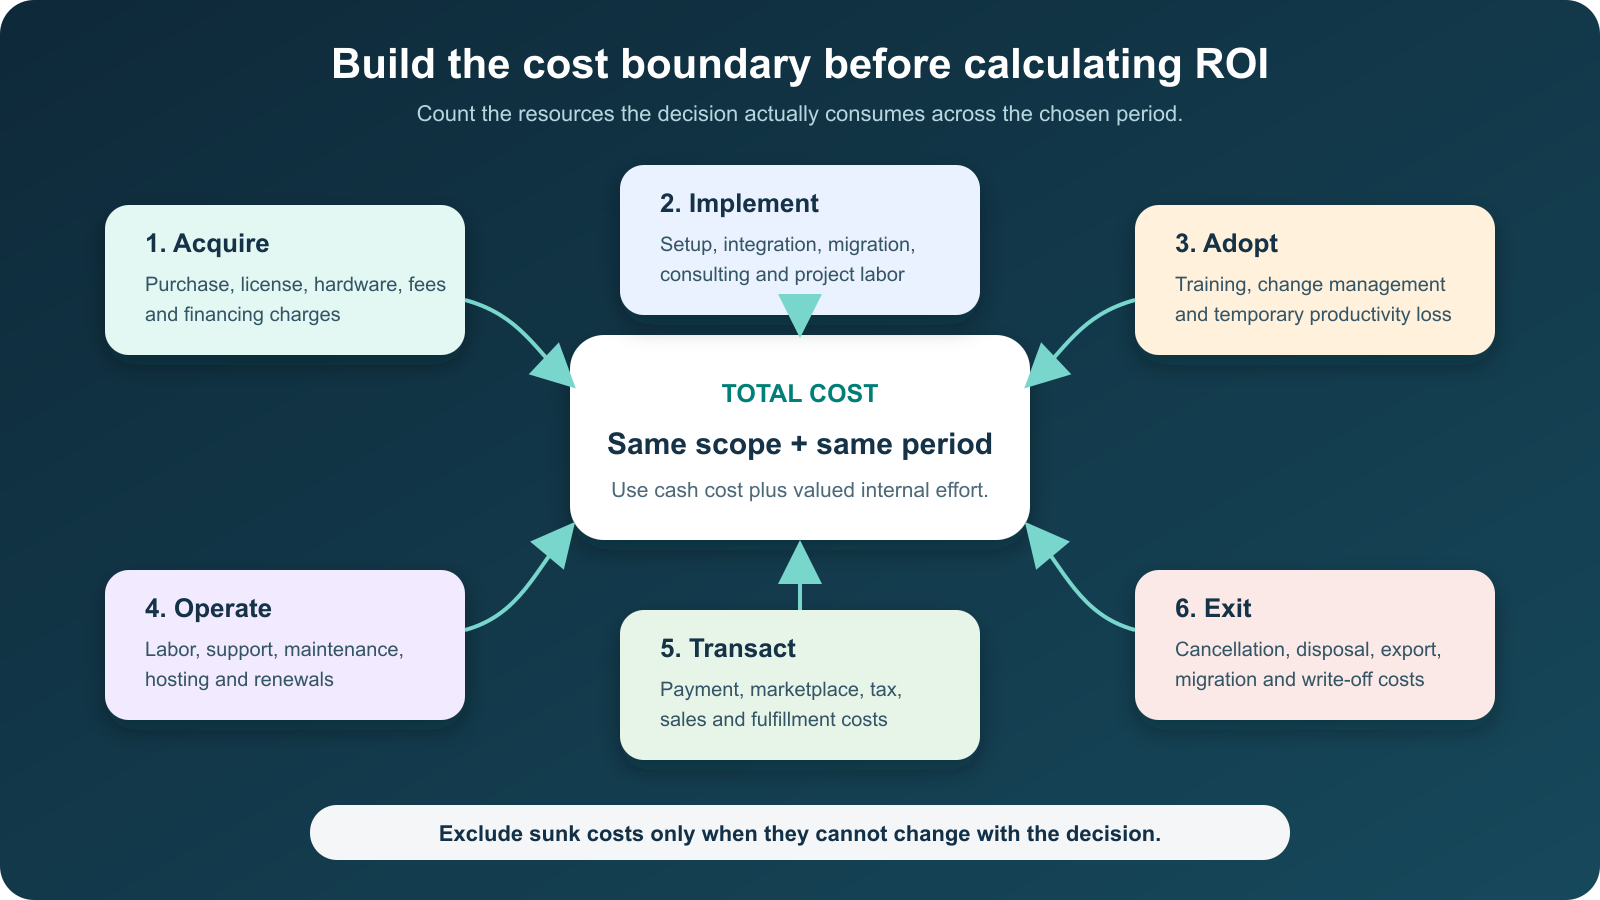
For a forward-looking decision, exclude a sunk cost only when it has already occurred and cannot change under any remaining option. Include future costs that can still be avoided. For a retrospective ROI report covering the whole project, the historical implementation spending belongs in the result because the report is measuring what the project consumed.
Internal labor is a real resource even when no extra invoice arrives. Multiply relevant hours by a documented loaded rate that reflects the cost basis your organization uses. Do not count every employee salary touched by the project; count the portion of time the investment actually requires or releases.
Calculate ROI in four auditable steps
- Fix the period and baseline. Choose one start date, end date, and counterfactual for both value and cost.
- Measure incremental value. Use contribution profit rather than revenue when goods or services have variable costs. Add documented cash savings and monetized capacity only once.
- Add total cost. Include relevant acquisition, implementation, adoption, operating, transaction, and exit costs for the same period.
- Calculate and stress-test. Subtract cost from value, divide by cost, then change the uncertain inputs to see whether the decision survives a conservative case.
Keep the worksheet’s raw currency amounts beside the percentage. A 40% ROI calculated from rounded estimates is not accurate to four decimal places, and a percentage without its dollar base can hide how little—or how much—value is at stake.
Three worked ROI examples
1. A one-time purchase and resale
Assume an asset costs $4,000 including purchase and transaction fees. It later produces $500 in cash income and is sold for $5,500 after selling fees. Total value received is $6,000.
ROI = ($6,000 − $4,000) ÷ $4,000 × 100 = 50%
The net gain is $2,000. State the holding period beside the result: 50% over six months is not directly comparable with 50% over five years.
2. A marketing campaign: ROI is not ROAS
Assume a campaign is credited with $12,000 of revenue. The products sold cost $6,000 to fulfill, ad spend is $2,000, and an agency charges $1,000. Under this stated boundary:
ROI = ($12,000 − $9,000) ÷ $9,000 × 100 = 33.3%
The same campaign’s return on ad spend is $12,000 ÷ $2,000 = 6, or 600% ROAS. That is not a 600% ROI because ROAS compares attributed revenue only with ad spend. Google Ads’ ROI explanation likewise subtracts overall cost, including cost of goods and advertising cost, before dividing by cost.
Attribution is a separate question. If some of the $12,000 would have occurred without the campaign, attributed revenue overstates incremental value. Google’s Conversion Lift documentation distinguishes ordinary attributed conversions from incremental conversions measured against a control group. Smaller teams may instead use a documented baseline, geographic holdout, or time-bound experiment. A memorable vanity URL with consistent tracking parameters can improve campaign attribution, but the URL itself does not prove causation.
3. A software automation purchase
Assume a team evaluates one year of a tool using these documented estimates:
| Item | Calculation | Amount |
|---|---|---|
| Annual subscription | Quoted annual cost | $2,400 cost |
| Setup and training | 40 hours × $45 loaded hourly cost | $1,800 cost |
| Total cost | $2,400 + $1,800 | $4,200 |
| Labor capacity released | 5 hours/month × 12 × $45 | $2,700 value |
| Avoided contractor spend | Invoices no longer required | $3,000 value |
| Total value | $2,700 + $3,000 | $5,700 |
ROI = ($5,700 − $4,200) ÷ $4,200 × 100 = 35.7%
The base case produces $1,500 of net value. With the $3,000 contractor saving held constant, break-even requires the tool to release about 26.7 labor hours per year, or 2.22 hours per month: ($4,200 − $3,000) ÷ $45 ÷ 12.
Use a range when the inputs are uncertain
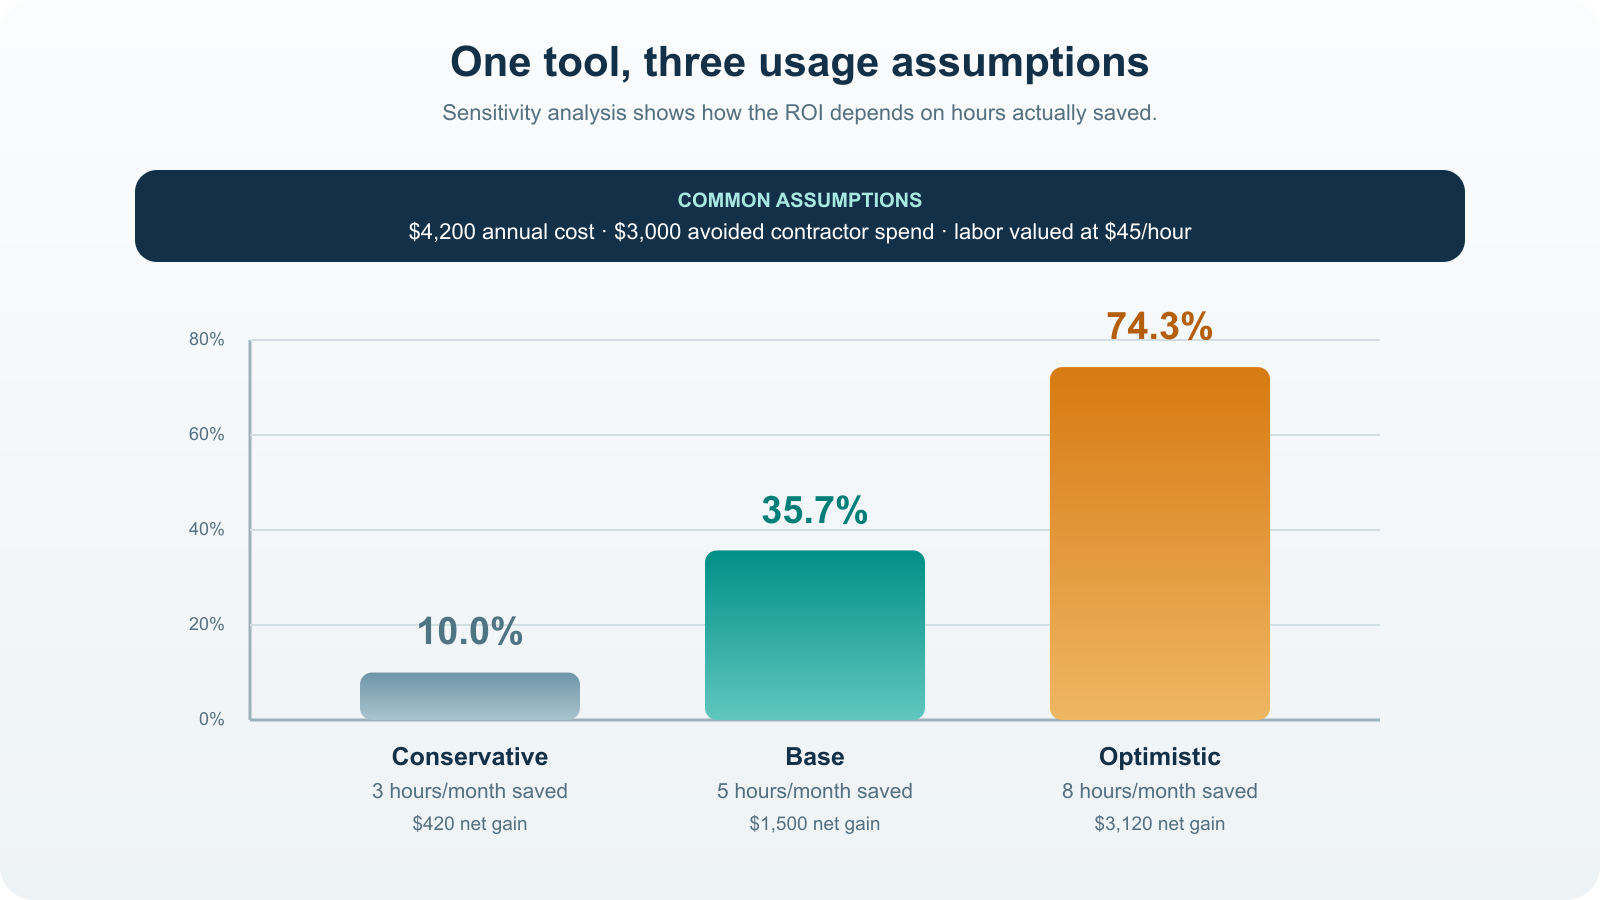
The software result depends heavily on whether five hours per month are actually released and put to useful work. Keep all other assumptions constant, then calculate a conservative, base, and optimistic case:
| Case | Hours saved per month | Total value | Net gain | ROI |
|---|---|---|---|---|
| Conservative | 3 | $4,620 | $420 | 10.0% |
| Base | 5 | $5,700 | $1,500 | 35.7% |
| Optimistic | 8 | $7,320 | $3,120 | 74.3% |
This range is more decision-useful than presenting 35.7% as a certain forecast. Assign an owner to measure adoption, hours released, contractor invoices, and ongoing cost after launch. If released time is simply absorbed by idle work, it may be capacity but not a cash saving; label it accordingly instead of presenting it as money in the bank.
Do not let the percentage make the decision alone
ROI measures efficiency relative to cost, not total value. Project A may cost $1,000, return $2,000, and show 100% ROI with a $1,000 net gain. Project B may cost $100,000, return $130,000, and show only 30% ROI while creating a $30,000 net gain. Limited capital may favor A; a value-maximizing organization with sufficient capacity may prefer B. Risk, timing, and strategic fit can reverse either choice.
Report a compact decision set beside ROI:
- net value in currency;
- total cost and affordability;
- measurement period and payback timing;
- conservative/base/optimistic range;
- the two assumptions that move the result most;
- material benefits or harms that were not monetized.
ToolMerit’s rule is simple: if two options do not share a baseline, cost boundary, period, and value method, their ROI percentages do not belong in the same ranking.
Know when to switch metrics
| Metric | Best question | Use it instead of simple ROI when |
|---|---|---|
| ROAS | How much attributed revenue did each advertising dollar produce? | You are optimizing media efficiency and will evaluate profit separately. |
| Payback period | How long until cumulative net cash inflows recover the investment? | Liquidity or recovery speed is the binding constraint. |
| Net present value (NPV) | How much value do dated future cash flows create in today’s money? | The project spans years and the time value of money matters. |
| IRR or XIRR | Which annualized discount rate makes the cash-flow series break even in present-value terms? | You need a time-aware percentage return; XIRR is designed for irregularly dated cash flows. |
| Benefit-cost ratio | How many dollars of gross benefit occur per dollar of cost? | Stakeholders explicitly use benefits divided by costs; label it clearly because its break-even value is 1.0, not 0%. |
Microsoft’s NPV and IRR guidance explains why timing matters: those methods discount cash flows, while XIRR handles cash flows that occur on irregular dates. Simple ROI does neither.
Where simple ROI stops being enough
Stop at a range rather than a single ROI when value depends on uncertain adoption, attribution, resale price, or future savings. Switch to NPV, IRR, or XIRR when cash-flow timing is material. Keep nonfinancial outcomes in a separate, explicit score when monetizing them would require invented prices. And do not approve a project on projected ROI alone when the baseline, owner, and post-launch measurement plan are missing.
A defensible ROI is therefore not the biggest percentage in the deck. It is the result another person can reproduce from the stated baseline, period, value rule, full cost boundary, and assumptions—and later replace with realized evidence.