
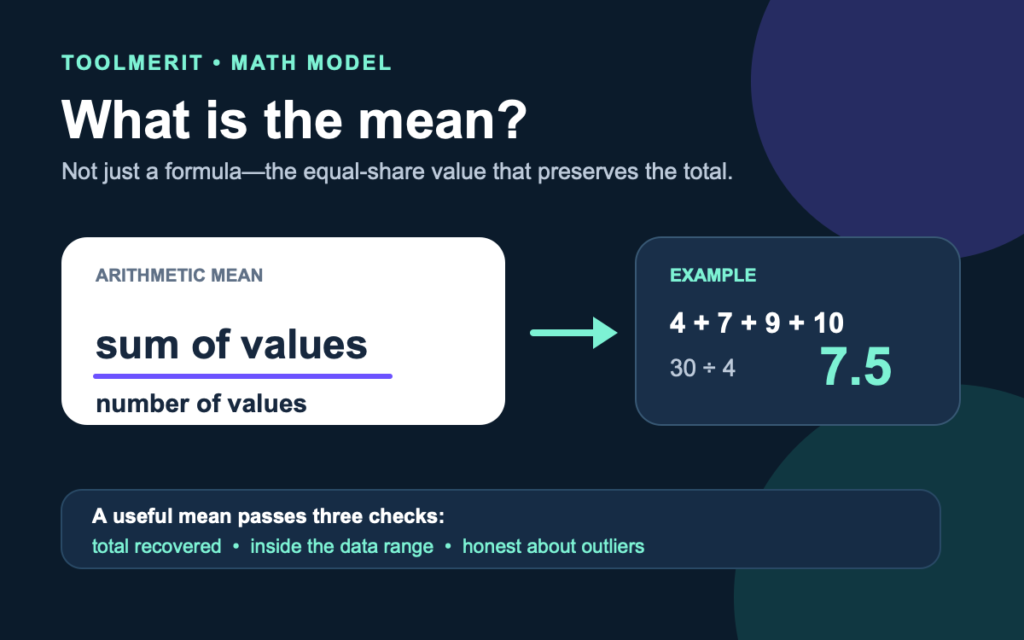
The arithmetic mean is sum divided by count—but the useful skill is knowing what that result represents, how to check it, and when not to use it.
“What is mean?” can sound like an English-language question, but in a math problem, mean is usually a noun: it means the arithmetic average. Add every numerical value, then divide the total by the number of values.
In basic math, the mean usually means the arithmetic mean: add every numerical value, then divide that total by the number of values. It behaves like an equal-share or balance value, but a large outlier can pull it away from what is typical.
For 4, 7, 9, and 10, the sum is 30 and the count is 4, so the mean is 7.5. That calculation is easy. The more important skill is deciding whether 7.5 is a fair summary of the data.
Start with the right meaning of mean
The word mean has several jobs. As a verb, it can express a definition or intention. As an adjective, it can describe unkind behavior. In statistics, it is a noun naming a measure of center. If that grammar distinction is unfamiliar, first see how nouns behave inside a sentence; the rest of this guide uses only the mathematical noun.
In introductory math, an unqualified “mean” normally means the arithmetic mean. The NIST Dictionary of Algorithms and Data Structures defines it as the sum of the values divided by their number. More advanced work also uses geometric, harmonic, and weighted means; the NIST Digital Library of Mathematical Functions lists these as distinct formulas. Do not silently substitute one for another.
| Phrase in the task | What to calculate |
|---|---|
| Mean or arithmetic mean | Add all values, then divide by the count |
| Average | Usually the arithmetic mean, but confirm the context |
| Median | Order the values and find the middle position |
| Mode | Find the value or category occurring most often |
| Weighted mean | Give each value its stated weight before combining |
See the mean as an equal-share value
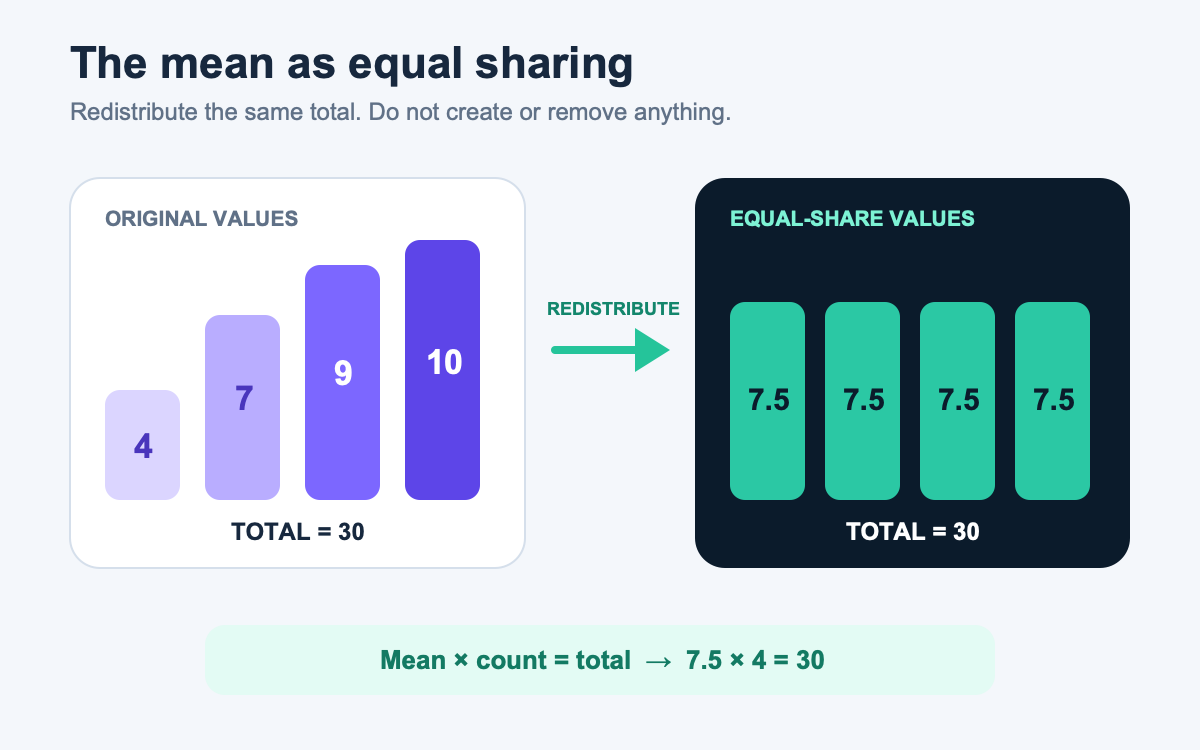
Return to 4, 7, 9, and 10. Together they contain 30 units. If those 30 units were redistributed equally across four positions, every position would hold 7.5. Nothing is created or removed:
4 + 7 + 9 + 10 = 30 = 7.5 + 7.5 + 7.5 + 7.5
This is why the mean is more than a memorized operation. It is the single equal-share value that preserves the original total. The original data do not have to contain the mean, and the mean does not have to be a whole number.
That interpretation also gives a useful identity:
Mean × count = total.
You can use the identity to check an answer, combine groups, or recover a missing value later.
Calculate the arithmetic mean without losing a value
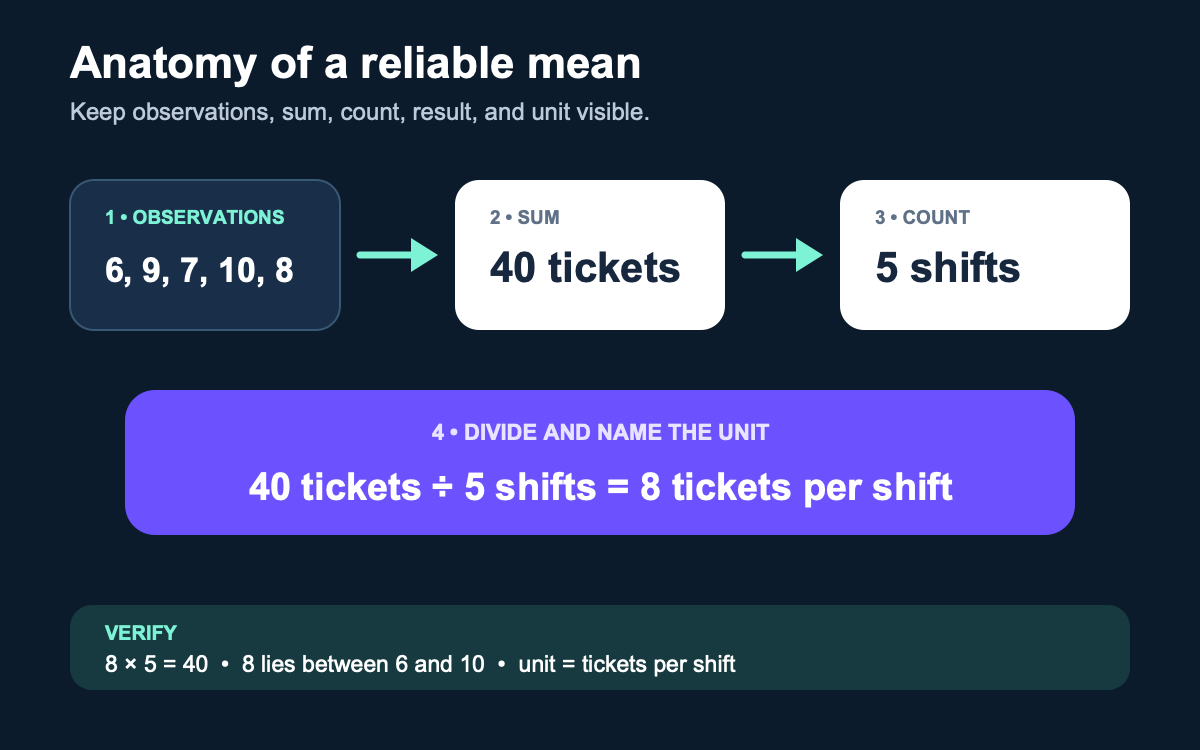
Suppose a support desk closed 6, 9, 7, 10, and 8 tickets over five shifts. Use one explicit line for each part of the calculation:
- List the observations: 6, 9, 7, 10, 8.
- Add them: 6 + 9 + 7 + 10 + 8 = 40.
- Count them: there are 5 shifts, not 4 addition signs.
- Divide: 40 ÷ 5 = 8 tickets per shift.
All observations must describe the same quantity in compatible units. Do not average 2 pounds with 12 ounces as the bare numbers 2 and 12; first convert pounds and ounces into one shared unit. Keep real zeros, because zero is a measured value. Treat a blank as missing information unless the source explicitly says it means zero.
For a longer list, you can build the calculation in a simple Excel table. Keep the raw values visible and calculate the sum and count alongside the average. A spreadsheet result is only as correct as the selected range and the records in it.
Check what the result actually represents
A calculator can confirm arithmetic but cannot confirm that you selected the right population. Run these three checks before reporting the number:
- Total check: multiply the mean by the count. For the ticket example, 8 × 5 must return 40.
- Range check: an ordinary arithmetic mean cannot be below the smallest value or above the largest. Here, 8 lies between 6 and 10.
- Meaning check: name the unit, time period, inclusion rule, and group. “8 tickets per shift for these five shifts” is defensible; “the team normally closes 8” claims more than the data prove.
Notation helps reveal scope. Penn State’s central-tendency reference uses x̄ (“x-bar”) for a sample mean and μ (“mu”) for a population mean. The formula is structurally the same, but a sample statistic is an estimate unless the observations cover the full population of interest.
In operational reporting, inspect the data grain before the formula. One row might mean a customer, an order, a line item, or a daily snapshot. If a dashboard result is surprising, trace how a data warehouse defines and groups records. For spending data, build a reconciled expense record before averaging so duplicates, transfers, and missing transactions do not become mathematical facts.
Know when the mean is the wrong summary
Consider response times of 2, 3, 3, 4, and 18 minutes. The sum is 30, so the mean is 6. The median is 3, and the mode is also 3. The mean is mathematically correct, but four of the five responses were faster than 6 minutes. The 18-minute case pulls the balance point upward.
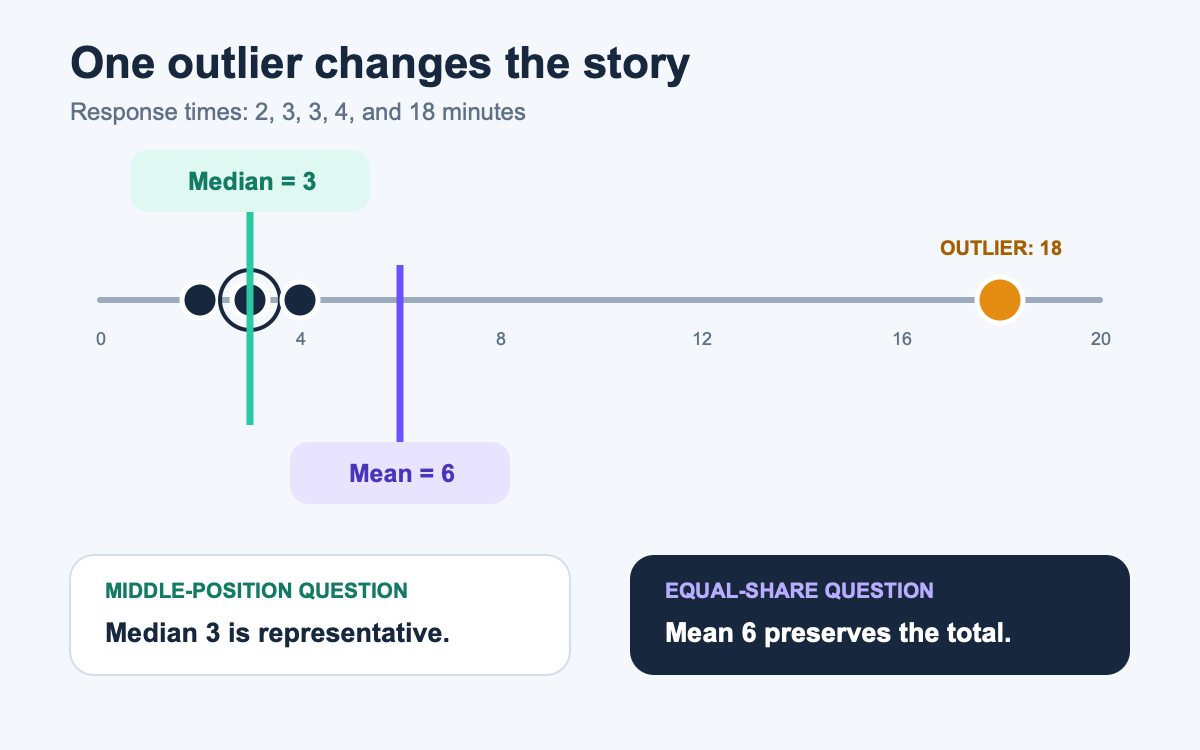
The NIST Engineering Statistics Handbook notes that extreme tail values can distort the mean and that the median can be a better location estimate for such data. OpenStax makes the same practical distinction in its comparison of mean, median, and mode.
Do not delete an outlier merely because it is inconvenient. Check whether it is a data error, a different population, or a real rare event. If it is real, report it honestly and choose the summary that answers the question. For the response-time data, “median 3 minutes; mean 6 minutes because one case took 18” communicates more than either number alone.
Reverse the formula to find a missing value
If the mean and count are known, recover the total first. Suppose a five-day work record has a mean of 8 hours, and four entries are 6, 7, 9, and 8 hours.
- Required total = mean × count = 8 × 5 = 40 hours.
- Known total = 6 + 7 + 9 + 8 = 30 hours.
- Missing value = 40 − 30 = 10 hours.
- Verification = (6 + 7 + 9 + 8 + 10) ÷ 5 = 8 hours.
This method is reliable only if the given mean is exact. If “8” was rounded from 7.6 or 8.4, the missing value is not uniquely determined. In a real work record, use the calculation as a clue while you keep the underlying time entries traceable; never replace the source record with an inferred value without verification.
Handle weights, percentages, and different group sizes
A simple mean gives every listed number equal influence. That is wrong when the numbers summarize groups of different sizes.
Campaign A records 10 conversions from 100 visits, a 10% rate. Campaign B records 9 conversions from 20 visits, a 45% rate. The simple mean of 10% and 45% is 27.5%, but the combined result is 19 conversions from 120 visits:
Combined rate = 19 ÷ 120 = 15.83%
The group rates need to be weighted by their visit counts. OpenStax’s weighted-mean explanation expresses the same rule: multiply each value by its weight, add those products, then divide by the total weight.
| Method | Calculation | Result | Valid here? |
|---|---|---|---|
| Simple mean of rates | (10% + 45%) ÷ 2 | 27.5% | No; the groups have unequal visits |
| Weighted/combined rate | (10 + 9) ÷ (100 + 20) | 15.83% | Yes; every visit has equal influence |
When the task is conversion analysis, calculate conversion rate from total conversions and visits. More generally, combine group means with (mean₁ × count₁ + mean₂ × count₂) ÷ total count. Never average percentages until you know their denominators and what the weights represent.
Choose the center that answers the real question
“Average” is not a complete instruction. Decide what kind of center the question needs:
| Use | When it fits | Main caution |
|---|---|---|
| Arithmetic mean | Numerical values share a unit and every observation should affect the balance | Extreme values can pull it |
| Median | You want the middle position or the data are strongly skewed | It does not preserve the total |
| Mode | You want the most common value or category | There may be no useful mode or several modes |
| Weighted mean | Values carry unequal counts, importance, credits, or probabilities | Wrong weights produce a polished wrong answer |
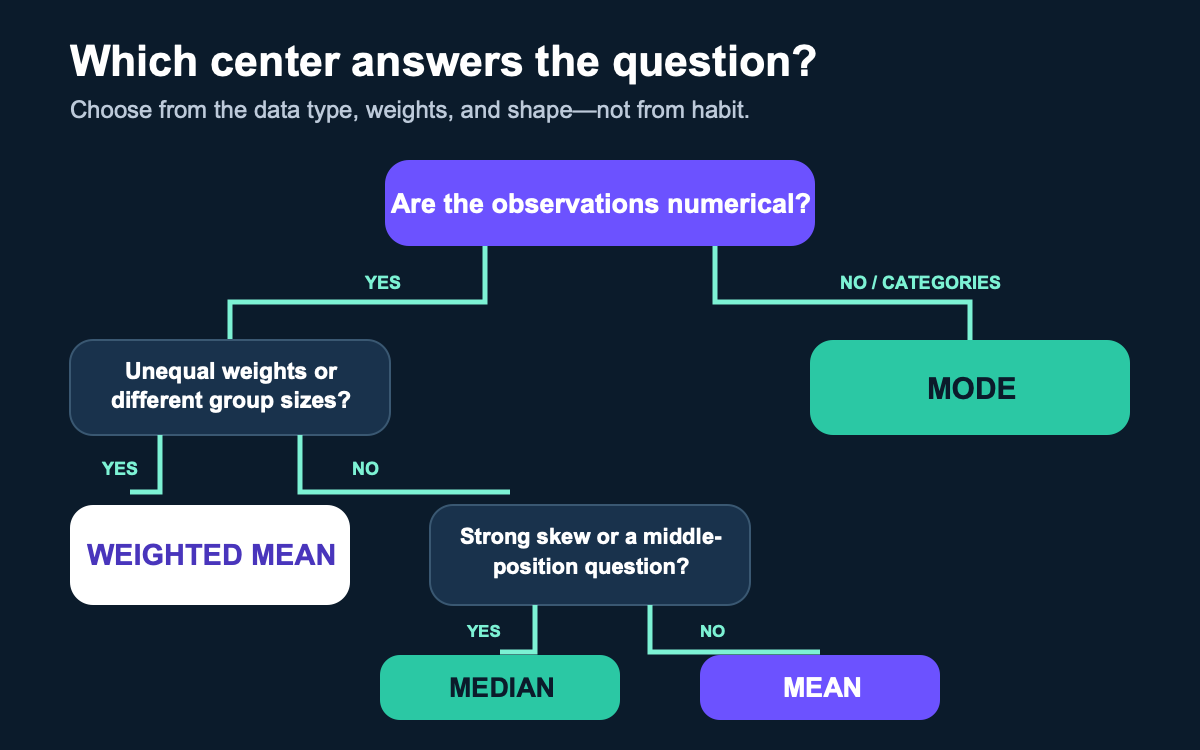
Also confirm that the requested metric is actually a center. A return ratio is a different calculation; if that is the business question, calculate ROI from net value and full cost instead of averaging unrelated dollar amounts.
As a final check, take 5, 7, 8, 10, and 10. Their sum is 40, so the mean is 8. Ordered, the middle value is also 8, while the most frequent value is 10. The arithmetic is settled; the wording decides the answer: use 8 for the equal-share balance, 8 for the middle position, or 10 for the most common observation.