
A landing page conversion is a verified visitor action that matches the page’s intended business outcome; the rate is meaningful only when its event, denominator, and counting rule are explicit.
A landing page conversion happens when a visitor completes the specific action the page was built to produce. That action might be a purchase, completed signup, qualified lead form, booked demo, phone call, or download. The page view itself is not a conversion unless viewing the page is deliberately defined as the goal.
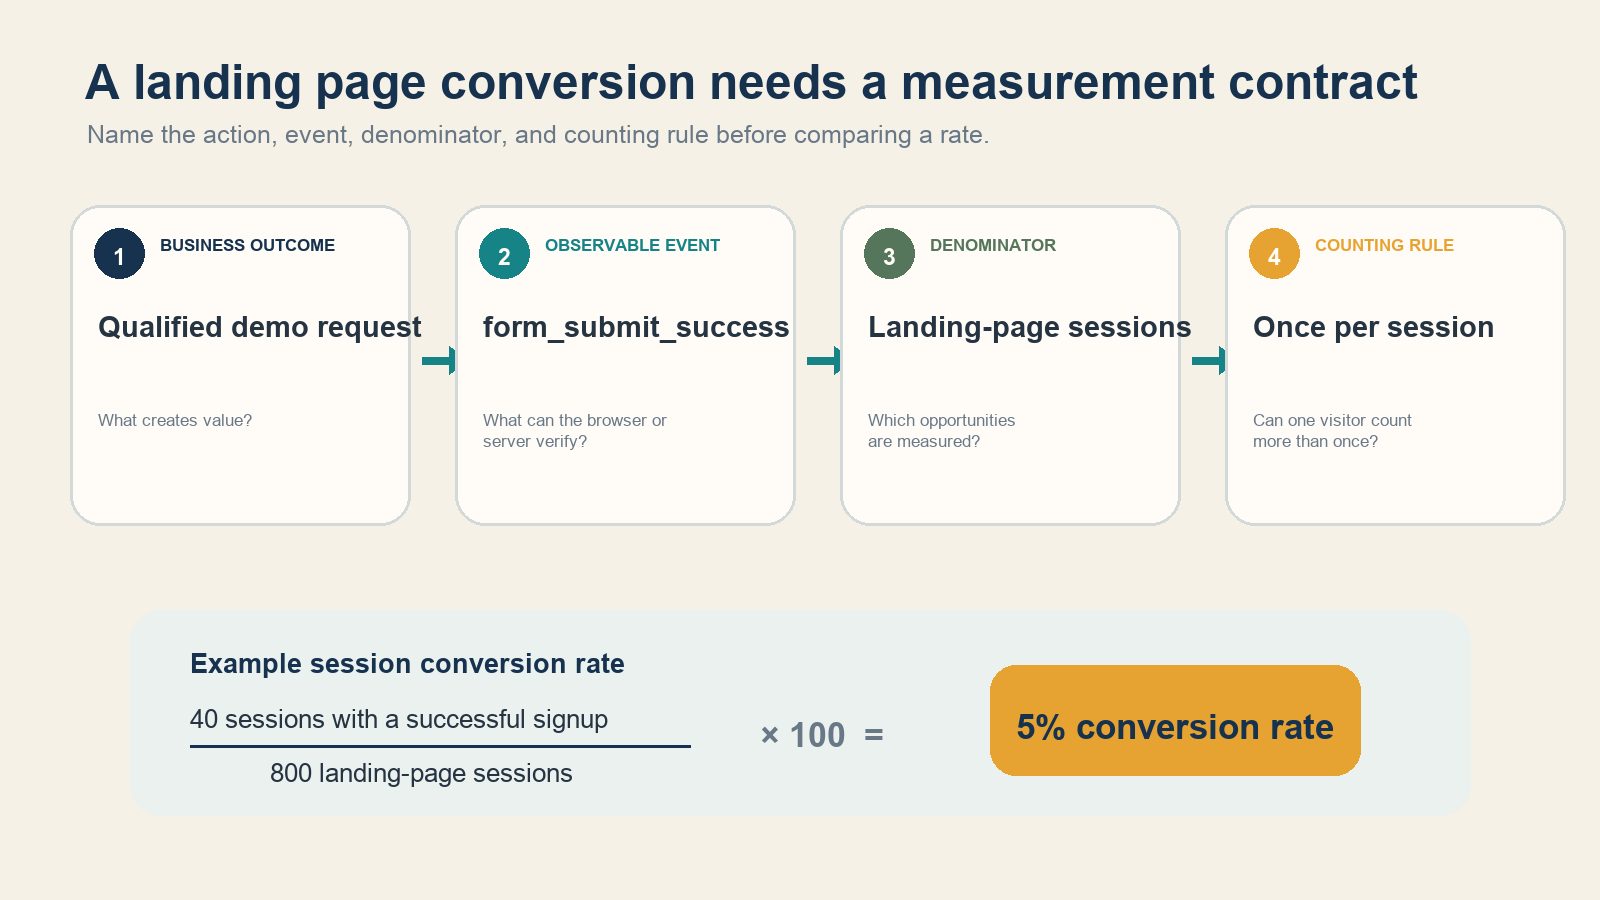
A useful conversion definition names four things: the business outcome, the observable event, the denominator used for the rate, and the counting rule. Without those decisions, two dashboards can show different “landing page conversion rates” while both are mathematically correct.

What counts as a landing page conversion?
A landing page is the first page a visitor reaches in a session or the destination reached after clicking a campaign link. Google Analytics defines its landing-page dimension as the page path and query string associated with the first pageview in a session. Google Ads uses a narrower campaign context: its landing-page glossary calls it the page people reach after clicking an ad.
The conversion should describe a valuable completed action, not just any interaction. Google Ads gives purchases, newsletter signups, and requests for more information as examples of conversions. Google Analytics now calls an event that is particularly important to a business a key event; a Google Ads conversion can be created from that key event.
Examples by page purpose include:
- Ecommerce product page: completed purchase, not merely clicking “Add to cart.”
- Lead-generation page: accepted form submission or qualified appointment.
- Free-trial page: verified account creation or trial activation.
- App page: install or completed onboarding, depending on the campaign goal.
- Resource page: delivered download or confirmed email signup.
Earlier actions can still be tracked as diagnostic micro-conversions. A CTA click, video play, form start, or pricing-table view helps explain behavior, but it should not silently replace the primary business outcome.
How to calculate landing page conversion rate
The familiar formula is:
Conversion rate = conversions ÷ eligible opportunities × 100
The phrase eligible opportunities is where definitions diverge. In a landing-page report, a team might divide sessions containing a successful action by landing-page sessions. In Google Ads, conversion rate is conversions divided by eligible ad interactions attributable to a conversion during the period.
For example, if 40 of 800 landing-page sessions produce a successful signup, the session conversion rate is 5%. If the ad platform shows 780 eligible interactions rather than 800 sessions, its rate will differ. Neither number is necessarily wrong; they answer different questions.
Write a measurement contract before opening the dashboard
A short measurement contract prevents vague reporting. Record these fields beside every primary conversion:
- Outcome: what valuable state has the visitor reached?
- Event: what browser or server signal proves it happened?
- Denominator: sessions, users, ad clicks, or eligible interactions?
- Counting rule: once per session, once per user, or every occurrence?
- Attribution scope: which landing page, source, campaign, and lookback rules receive credit?
- Exclusions: are staff, test orders, spam, duplicate leads, and refunds removed?
Counting rules matter more than they first appear. Google Ads notes that a reported conversion rate can exceed 100% when multiple actions are tracked and the account counts every conversion per interaction. A rate above 100% is therefore not automatically a calculation error, but it should trigger a review of what is being counted.
Track success, not just the button click
The strongest event occurs after the system verifies the outcome. For a lead form, a click on “Submit” is only an attempt. Validation may fail, the network may time out, or the server may reject a duplicate. Prefer a success response, created lead ID, completed order, or confirmation state.
Thank-you pages can work as conversion pages when only successful users can reach them. Google Ads describes a conversion page as a page such as a purchase confirmation or thank-you page reached after the valued action. Protect it from ordinary navigation and repeat reloads, or use an event with a transaction or lead identifier to reduce duplicates.
Before trusting a new event, complete it yourself on desktop and mobile, inspect the analytics debug stream, compare the event count with server or CRM records, and test validation failures. Also verify consent behavior, cross-domain navigation, payment redirects, and URL parameters. A beautifully optimized page paired with broken measurement produces confident but false conclusions.
Diagnose a low conversion rate as a funnel
A single page-level rate compresses several possible failures. Break the journey into observable stages: campaign click, page arrival, CTA start, form or checkout start, and verified success.
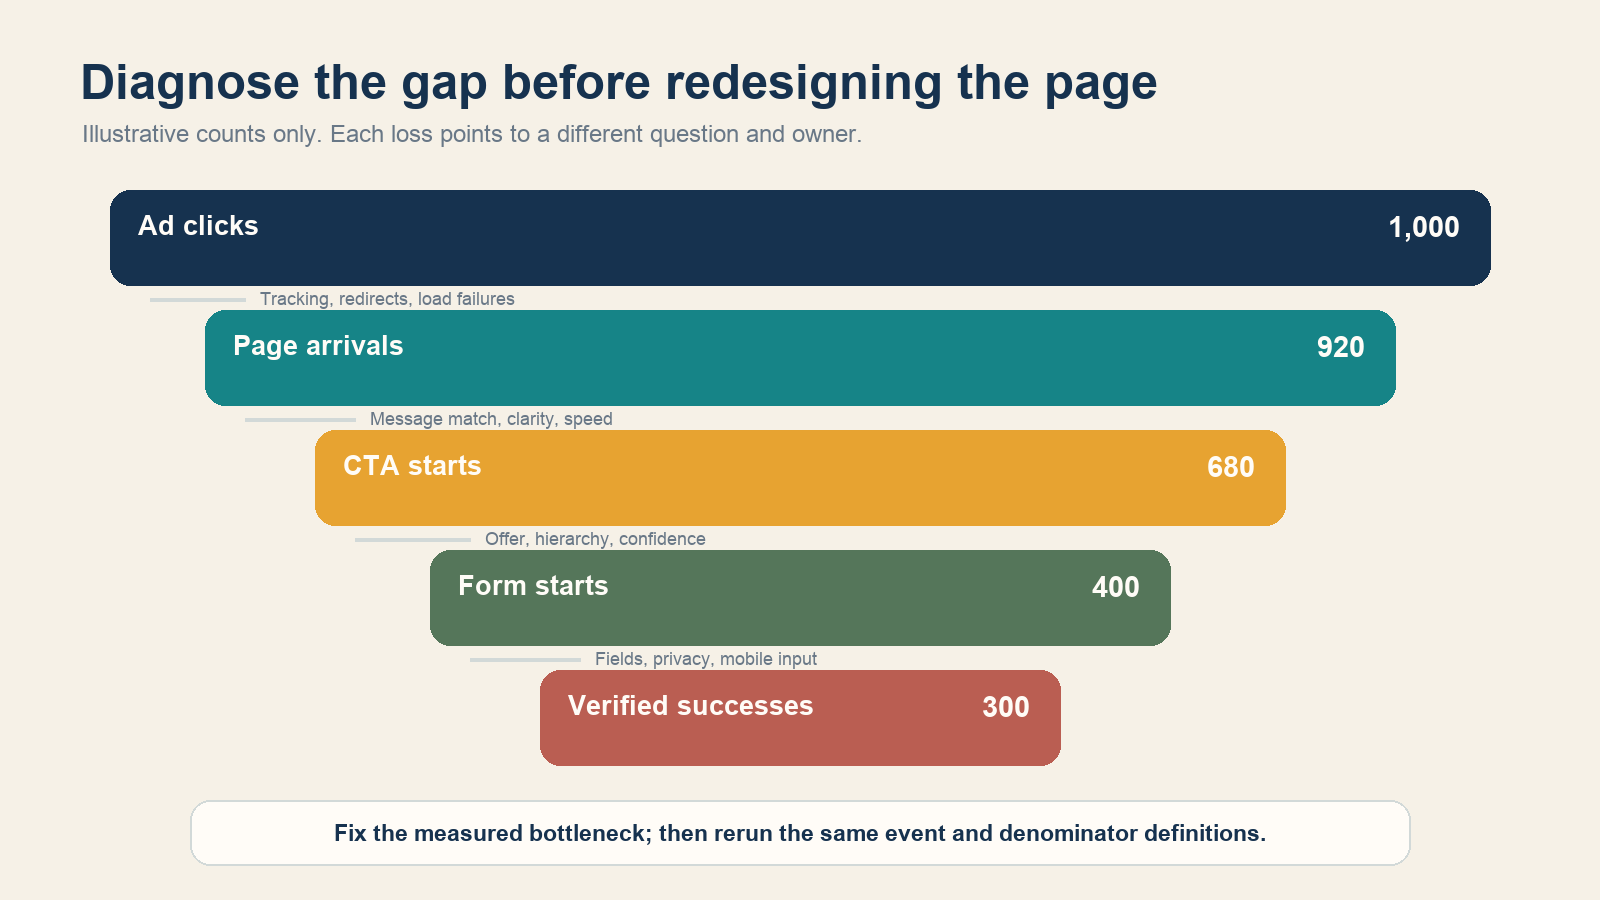
Large losses between clicks and arrivals suggest tracking, redirects, load failures, or accidental clicks. Losses before the CTA suggest weak message match, unclear value, poor visual hierarchy, low trust, or slow loading. Losses after a form starts suggest unnecessary fields, confusing validation, privacy concerns, mobile-input friction, or a server problem.
Google Ads recommends keeping the ad, keyword, offer, and landing-page message consistent. Its landing-page guidance also emphasizes relevance, useful original content, mobile friendliness, easy navigation, and fast access to the intended action. These are better starting hypotheses than changing colors at random.
What is a good landing page conversion rate?
There is no honest universal answer. A free checklist, a $20 purchase, a $50,000 enterprise demo, and a regulated application ask for different levels of commitment. Traffic temperature, source, device, country, offer, price, brand familiarity, and counting rules change the rate.
Use three comparisons instead:
- Your own baseline: the same event, denominator, audience, and time window.
- A controlled variant: a randomized test where only the intended change differs.
- Business value: qualified leads, revenue, margin, retention, or another downstream outcome—not conversion volume alone.
A page can raise its signup rate by promising the wrong thing or attracting low-quality leads. That is a measurement win and a business loss. When conversion actions have different values, Google Ads recommends assigning conversion values so reporting can represent impact rather than only count.
Improve the page in dependency order
- Verify measurement. Reconcile analytics with the order system, CRM, or database.
- Match the promise. Repeat the campaign’s audience, offer, price, and qualification conditions accurately.
- Clarify the decision. State what the visitor gets, for whom, at what cost, and what happens next.
- Remove task friction. Shorten forms to necessary fields, preserve input, show useful errors, and make the primary action obvious.
- Fix mobile and speed defects. Test real devices and field performance. Google’s current good Core Web Vitals targets are LCP within 2.5 seconds, INP under 200 milliseconds, and CLS below 0.1.
- Test one hypothesis. Define the expected mechanism, primary metric, guardrail, duration, and stopping rule before viewing results.
- Check downstream quality. Confirm that converted users become valid customers, retained users, or qualified leads.
A practical decision rule
If a report says “landing page conversion,” ask one question before discussing design: which completed action, divided by which opportunities, counted how many times? Then verify the event against the system of record.
Only after that should you diagnose the page. Repair the largest measured gap, preserve the measurement contract, and compare the same audience and outcome again. That process turns conversion from a vague compliment about a page into a testable business result.