
Tool A
Verify current pricingTOOL COMPARISON
Tool A vs Tool B
A practical comparison for people choosing between two tools that solve a similar job in different ways.
THE QUICK CALL
Bandwidth is carrying capacity; latency is travel delay. A connection needs the right amount of both for the task—not just a large Mbps number.
Teams with the workflow described in this comparison.
See the differences ↓Teams with a different set of needs and constraints.
See the differences ↓AT A GLANCE
The useful differences, side by side.
| What matters | Tool A | Tool B |
|---|---|---|
| Primary job | A practical use case | A different practical use case |
| Learning curve | What the team must learn | What the team must learn |
| Pricing model | Verify current pricing | Verify current pricing |
| Best next step | Read the full review | Read the full review |
Price and plan details can change. Verify current limits and pricing at the source before deciding.
WORKFLOW FIT
The question is not which tool has more features. It is what the team needs to get done.
Choose a path where Tool A is responsible for a clear part of the workflow.
Add concrete examples, onboarding considerations, integrations, and evidence from a real test or source review here.
Choose a path where Tool B removes a specific bottleneck for your team.
Add concrete examples, onboarding considerations, integrations, and evidence from a real test or source review here.
Latency is the time data takes to travel across a network path, usually expressed in milliseconds; bandwidth is the path’s data-carrying capacity, usually expressed in bits per second. Low latency makes interactions respond sooner, while more bandwidth lets more data move at once.
They are not two names for internet speed. A 1 Gbps connection can still feel delayed if every exchange has a long round-trip time, and a low-latency connection can still take minutes to move a large file if its available capacity is small.

Compare latency and bandwidth directly
| Question | Latency | Bandwidth |
|---|---|---|
| What does it describe? | Delay across a particular path | Data-carrying capacity of a link or path |
| Typical unit | Milliseconds (ms) | Megabits or gigabits per second (Mbps or Gbps) |
| Better direction | Lower, while remaining stable | Higher, until the workload has enough |
| Most visible symptom | Lag before an action or reply | Slow large transfers, buffering, or contention |
| Common speed-test label | Ping or latency | Download and upload speed |
| Typical fixes | Shorter path, less queueing, better Wi-Fi, better routing | More capacity, less competing traffic, faster Wi-Fi or wired links |
In networking standards, “bandwidth” is overloaded. RFC 5136 recommends more precise terms such as capacity and available capacity. Consumer services nevertheless use bandwidth for the plan’s nominal carrying capacity, so this article follows that familiar usage and names actual measured rate separately as throughput.
Distinguish capacity from throughput and goodput
A plan advertised at 500 Mbps does not promise that every download will deliver 500 Mbps of useful file data. Three layers of the number matter:
- Capacity is the maximum rate defined for a link or path under specified conditions and at a stated protocol layer.
- Available capacity is the portion not consumed by competing traffic at that moment.
- Throughput is the data rate a particular transfer actually achieves. Useful application data after overhead and retransmissions may be called goodput.
The narrowest link, busy Wi-Fi channel, 100 Mbps Ethernet port, VPN, remote server, loss, congestion control, and other users can all limit a test below the access plan’s headline. Upload and download are separate directions; a fast downstream does not guarantee enough upstream for cloud backup or multiple outgoing video feeds.
Measure latency as one-way delay or round-trip time
The IETF’s one-way delay metric measures from a packet leaving the source interface until it fully arrives at the destination interface. Accurate one-way measurement requires synchronized clocks, so consumer tools more commonly report round-trip time (RTT): send a probe and time the response.
RTT includes both directions and whatever path and endpoint the test uses. It is not a universal property of your internet service. A nearby test server, an overseas game server, and a work VPN can return very different results. Paths may also be asymmetric.
Record more than the minimum or average:
- Loaded latency: RTT while a download or upload fills the connection. A large jump exposes queueing that an idle ping misses.
- Delay variation (jitter): how much successive delays vary; calls and games can suffer even when the average looks acceptable.
- Packet loss: missing packets can trigger retransmission, conceal usable capacity, or damage real-time media.
Distance, propagation, transmission technology, routing, processing, and queueing all contribute. The FCC’s broadband measurement work separates a fixed component from a variable component that grows as a path becomes congested.
Treat latency and bandwidth as two independent axes
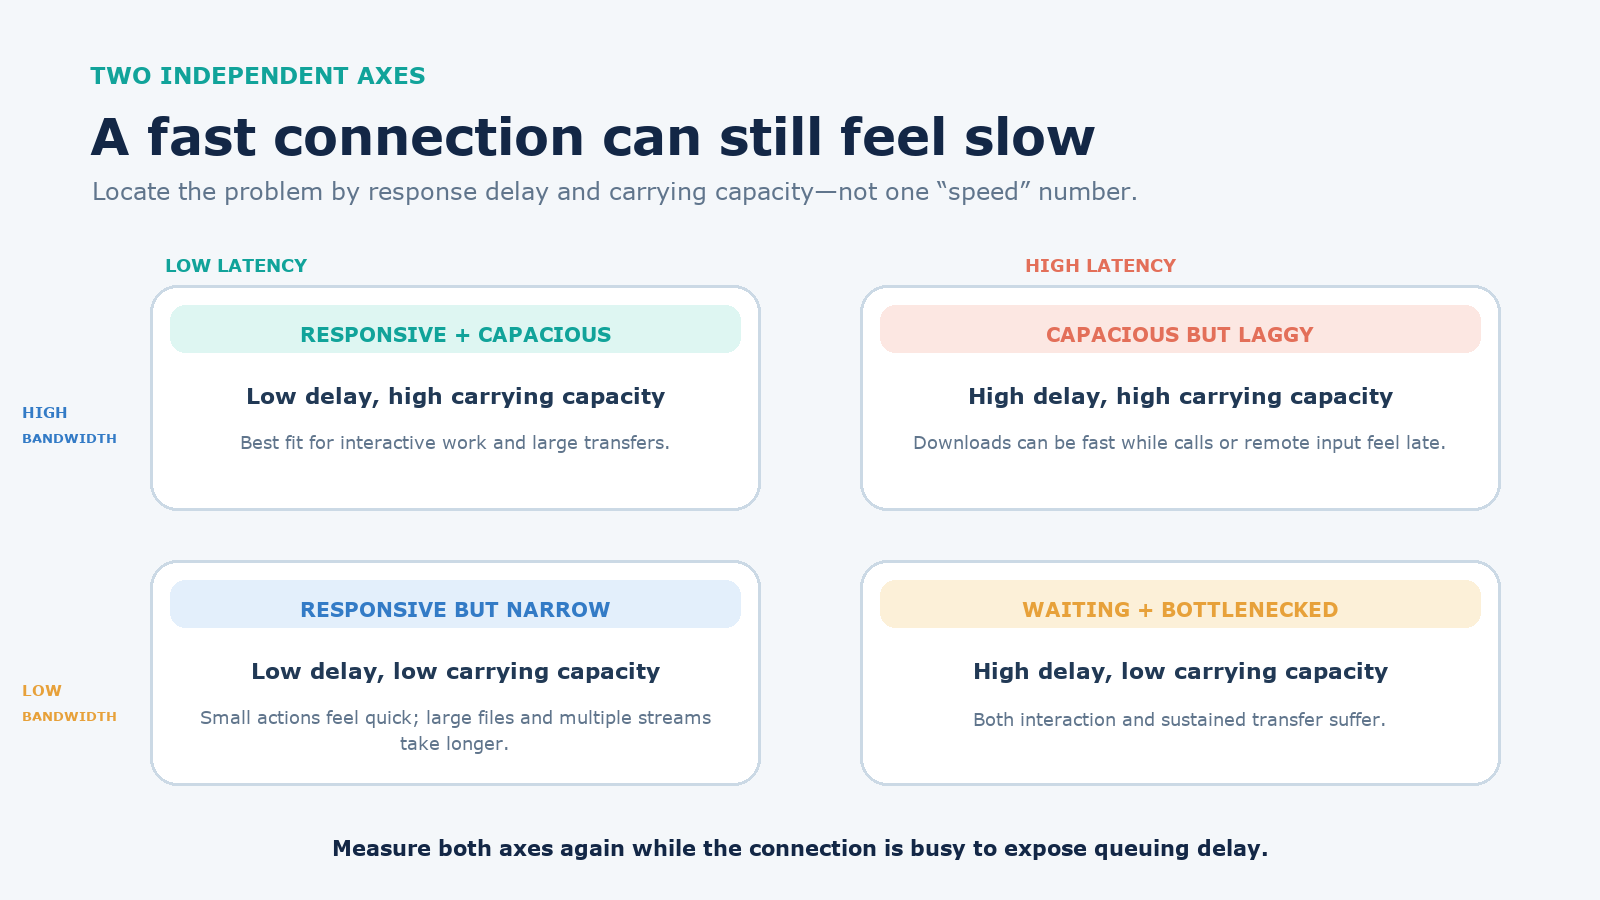
The upper-right combination—high bandwidth and high latency—is why a satellite or distant-server connection may finish a bulk download quickly yet feel late during remote control. The lower-left combination—low bandwidth and low latency—can make simple messages and small pages feel responsive while 4K streams or large backups struggle.
“High” and “low” are workload-relative, not universal pass/fail thresholds. A single voice call needs far less capacity than a household streaming several videos, while competitive interaction reacts more strongly to delay and variation than an overnight backup.
Calculate why object size changes which metric matters
For a simplified transfer, separate waiting from serialization:
rough network time = required round trips × RTT + object bits ÷ effective throughput
Consider a 1 MB object using decimal units: 1 MB × 8 = 8 megabits. At an ideal 10 Mbps, serialization takes 0.8 seconds. At 100 Mbps, it takes 0.08 seconds. Add one required RTT and three illustrative profiles produce the following result.
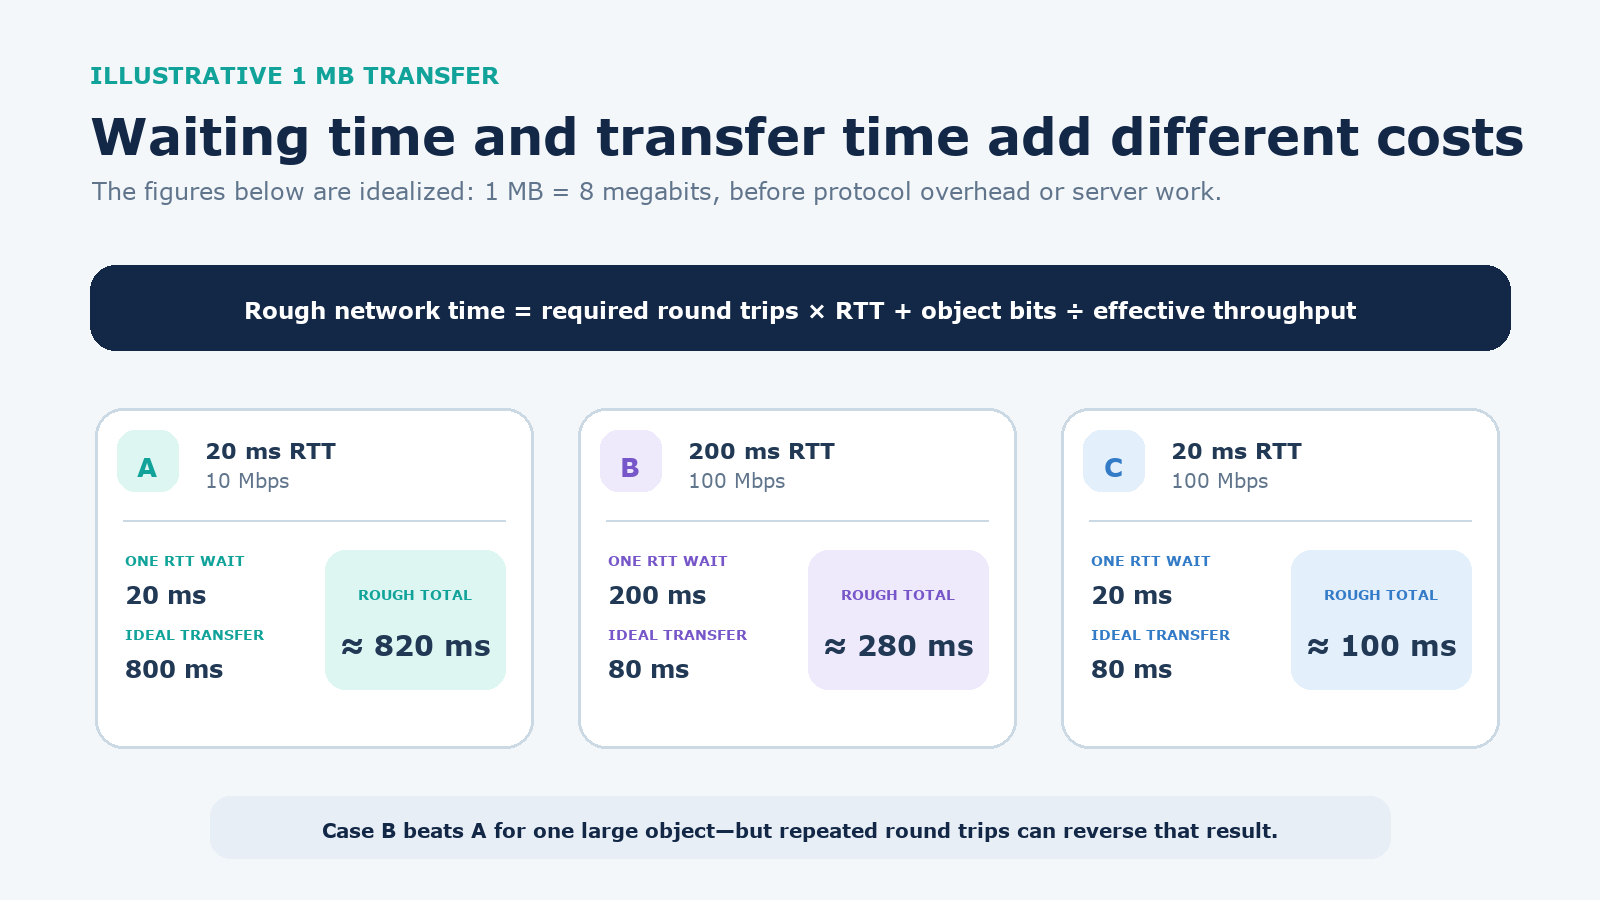
This is a teaching model, not a page-load predictor. Real transfers include DNS, connection setup, encryption, request dependencies, protocol overhead, server response time, congestion control, caching, loss, and rendering. MDN’s latency guide explains why the first web request may incur DNS, TCP, and TLS work and why multiple resources compound delay.
Match the bottleneck to the activity
| Activity | Usually most sensitive to | Do not ignore | Typical symptom |
|---|---|---|---|
| Web browsing | RTT, server response, request chains | Page weight and download throughput | Long pause before content appears |
| Cloud gaming or remote desktop | RTT, jitter, loss | Enough sustained up/down capacity | Input feels behind the action |
| Video call | Jitter, loss, RTT, upload capacity | Competing uploads | Talk-over, freezes, or degraded video |
| Streaming video | Sustained throughput and stability | Startup delay and household contention | Buffering or quality reductions |
| Large backup or download | Effective throughput | Loss, server limit, and RTT for transport behavior | Long completion time |
| Busy household | Available up/down capacity and queue management | Loaded latency and Wi-Fi airtime | Everything slows when one transfer starts |
Diagnose the connection instead of chasing one speed number
- Define the failing task and destination. Note the app, server region, time, device, and whether the symptom is delayed response, buffering, or slow completion.
- Establish a clean local path. Test over Ethernet if possible, or near the Wi-Fi access point with other heavy transfers paused.
- Measure both directions and RTT. Use a transparent test such as Measurement Lab’s NDT, which reports upload, download, and latency metrics for a single-stream bulk transfer. Repeat at different times.
- Compare idle and busy conditions. Start a sustained upload or download and watch RTT. A large increase points to queueing or saturation even if idle latency is low.
- Separate LAN from internet. Compare wired and Wi-Fi results, check link speed and router load, then test the affected service. A nearby speed server cannot certify the route to every destination.
- Change one variable. Try another cable, access point, device, server region, or time window. Keep a small table instead of relying on one screenshot.
Speed tests are samples of a specific method, time, endpoint, route, device, and connection. M-Lab describes NDT as asking how fast a device can push or pull data to a typically nearby, well-provisioned server—not as a guarantee for all applications.
Choose the fix that targets the measured constraint
If sustained throughput is the problem, check whether the plan, modem, router port, Ethernet cable, Wi-Fi standard, channel conditions, or remote service is the limiting link. Upgrading the plan only helps when the access service is actually the narrow part of the path.
If idle latency is high only to a particular region, choose a nearer server when possible, remove unnecessary VPN detours, or ask the provider about routing. Physical distance and the access technology set a floor that a higher Mbps tier cannot erase.
If latency rises sharply under load, reduce simultaneous traffic or use competent queue management on a correctly sized router. Do not set arbitrary quality-of-service limits without measuring them; a badly configured shaper can simply become a smaller bottleneck.
If Wi-Fi is the divider, improve access-point placement, avoid weak or congested channels, use a wired backhaul, or connect latency-sensitive devices by Ethernet. Test near the router before replacing the internet plan.
For a website, reduce both axes’ cost: serve fewer bytes, compress and resize assets, cache responses near users, avoid unnecessary hostnames and dependent request chains, and improve server response time. More server bandwidth will not remove repeated RTTs, while a nearby edge cache will not rescue an oversized page on a narrow mobile link.
The decision rule is simple: upgrade bandwidth when useful transfers saturate available capacity; reduce latency when interaction waits on round trips; fix queueing when latency spikes under load. Measure all three conditions before buying the solution.
PRICE & PLAN REALITY
Compare the cost of the workflow, not just the entry price.
Check the team size, usage caps, add-ons, and the upgrade point that applies to your use case.
Check Tool A pricing →Check the team size, usage caps, add-ons, and the upgrade point that applies to your use case.
Check Tool B pricing →THE TRADE-OFF
Every “best” choice carries a cost.
What Tool A may ask of you
Document the learning curve, setup time, constraints, and reasons a prospective user could regret choosing it.
What Tool B may ask of you
Document the learning curve, setup time, constraints, and reasons a prospective user could regret choosing it.
A THIRD OPTION
When neither tool is the answer.
Neither tool is a good fit when the real problem is unclear, the workflow is not defined, or the team cannot maintain another system.
Find a better fit →HOW WE COMPARED THEM
What supports this comparison.
● Source-verified comparison
We compare tools using the evidence we have actually gathered: hands-on testing, limited trial work, official documentation, verified pricing, or editorial research. We label the status rather than implying experience we do not have.
- Last checked
- August 2026
- Responsible editor
- ToolMerit Editorial Team
- Pricing source
- Official pages, verified August 2026
EDITORIAL INDEPENDENCE
The fit determines the conclusion.
ToolMerit may earn a commission when you use selected links. That does not determine which tool we recommend, how we compare them, or whether we say neither is a good fit. Read our disclosure →