

Dividend yield compares an annual dividend with today's share price. Reproduce the numerator, date the price, and test the payment before relying on it.

Dividend yield is the annual dividend per share divided by the current share price, expressed as a percentage. If a stock pays a regular annual dividend of $1.20 per share and trades at $30, its dividend yield is 4%: $1.20 ÷ $30 × 100 = 4%.
That answer is simple, but using it well requires three decisions the percentage does not reveal: which dividend amount was annualized, which share price was used, and whether the payment is likely to continue. A quote page may display a mathematically correct yield that is still unsuitable for estimating next year’s income.
Use dividend yield to answer one narrow question: How large is the stated annual dividend compared with the price of one share now? Do not read it as a promised return, a safety grade, or proof that a stock is cheap.
Build the ratio from two dated inputs
The formula is:
Dividend yield = annual dividend per share ÷ current share price × 100
Write a date beside both inputs. The price may change every trading day; a board can change or omit future dividends. If the latest regular quarterly dividend is $0.30 and the share price at the time of your check is $30, annualizing the regular rate gives:
- Annual regular dividend: 4 × $0.30 = $1.20 per share
- Yield as a decimal: $1.20 ÷ $30 = 0.04
- Yield as a percentage: 0.04 × 100 = 4%
If you own 250 shares, the same unchanged rate implies 250 × $1.20 = $300 in annual cash dividends before taxes, fees, reinvestment, or a future board decision. That is a planning estimate, not money already earned.
FINRA’s investment-value explanation describes yield as income earned without selling the investment and explains the inverse price-yield relationship. Its definition also places dividends alongside capital gains or losses when discussing total return.
Reconstruct the yield shown on a quote page
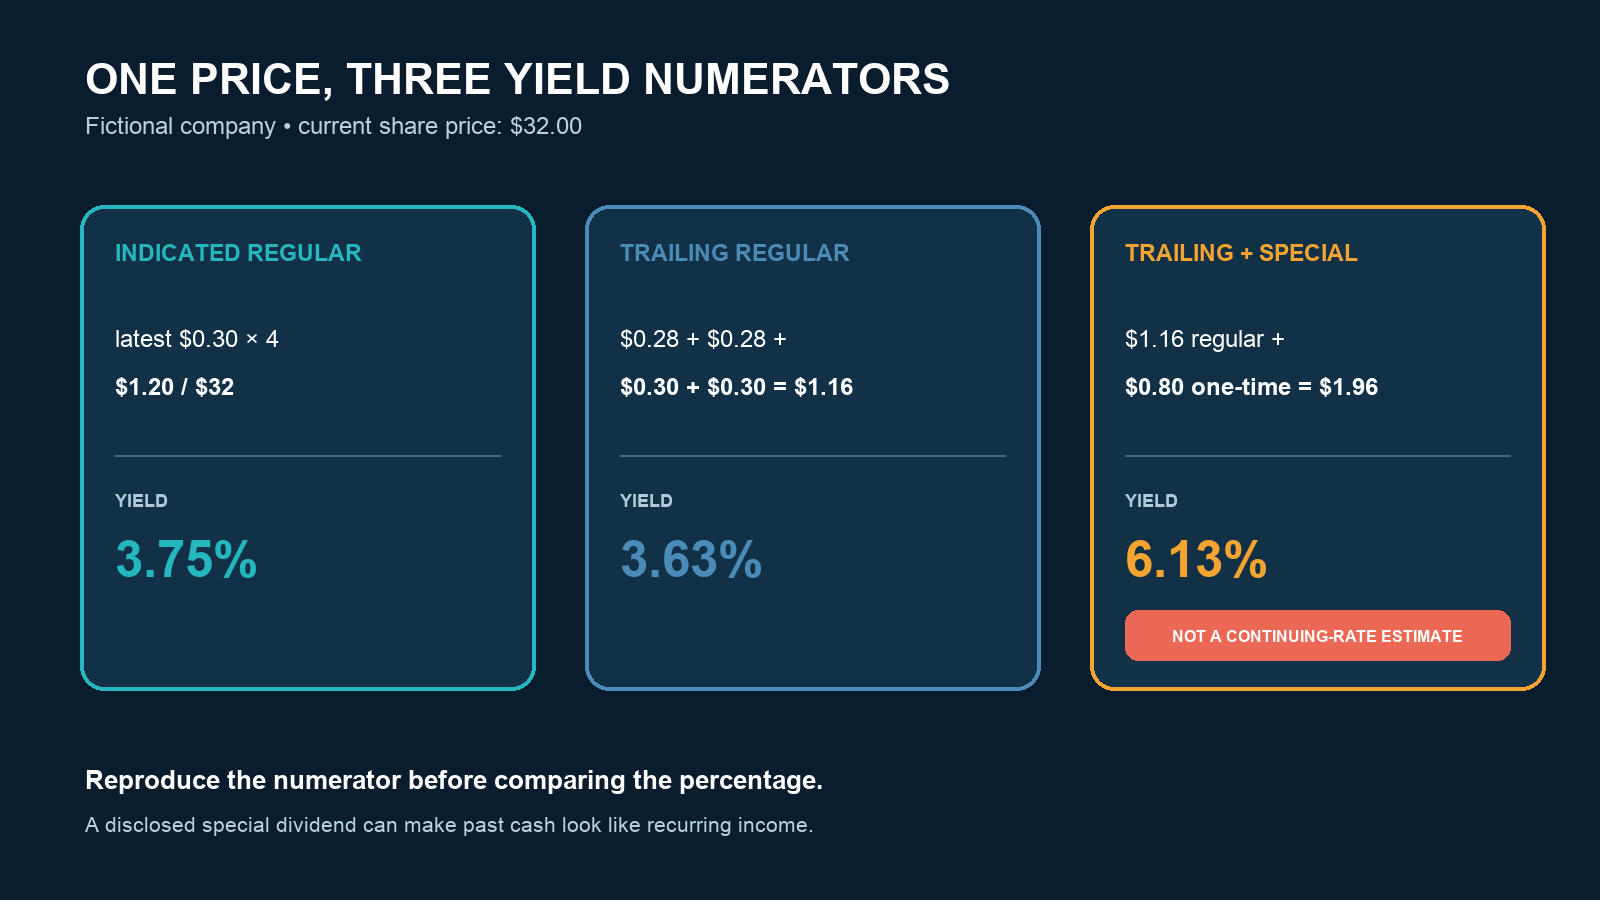
“Dividend yield” is not always calculated from the same numerator. Consider a fictional company whose four most recent regular quarterly payments were $0.28, $0.28, $0.30, and $0.30. It also paid a one-time $0.80 special dividend, and its current share price is $32.
| Displayed basis | Dividend input | Calculation at $32 | What it can answer |
|---|---|---|---|
| Indicated or forward regular rate | Latest $0.30 × 4 = $1.20 | $1.20 ÷ $32 = 3.75% | Income implied if the latest regular rate repeats |
| Trailing regular payments | $0.28 + $0.28 + $0.30 + $0.30 = $1.16 | $1.16 ÷ $32 = 3.63% | Regular dividends paid across the selected past period |
| Trailing cash including special | $1.16 + $0.80 = $1.96 | $1.96 ÷ $32 = 6.13% | Past cash paid, but not a clean estimate of the continuing rate |
All three calculations are arithmetically valid. Only the first two describe the regular dividend, and even they answer different questions. FINRA Regulatory Notice 08-77 distinguishes historical annual income from an indicated annual amount and warns that special or irregular dividends can distort estimated yield.
When two finance sites disagree, do not average them. Open each site’s methodology, list the payments it included, note the price timestamp, and reproduce the arithmetic. If the site does not disclose the basis, calculate the figure yourself from the issuer’s declarations.
Understand why yield changes
A yield can move even when the shareholder receives no new payment. Hold the $1.20 annual dividend constant:
- At a $40 price, the yield is 3%.
- At a $30 price, the yield is 4%.
- At a $20 price, the yield is 6%.
The 6% figure may look more attractive, but it was created entirely by a falling denominator. The market could be reacting to temporary uncertainty, or it could be pricing in weaker earnings, refinancing pressure, a dividend cut, or a deteriorating business. The yield itself cannot distinguish those explanations.
The ratio can also rise for a healthier reason: the board raises the regular dividend while price is unchanged. Or it can fall because price rises faster than the dividend. Always decompose the change into dividend movement and price movement before assigning meaning to it.
Stress-test the income estimate
Return to the 250-share example at $30 per share. The position costs $7,500 and the unchanged $1.20 annual rate implies $300 of cash, or a 4% current yield. Now test outcomes instead of treating the base case as certain:
| One-year illustration | Dividend cash | Ending share value | Combined value before tax and fees |
|---|---|---|---|
| Rate unchanged; price unchanged at $30 | $300 | $7,500 | $7,800 |
| Dividend cut in half; price falls to $24 | $150 | $6,000 | $6,150 |
| Rate unchanged; price rises to $33 | $300 | $8,250 | $8,550 |
These are not forecasts. They expose what “4% yield” leaves out: the payment can change and the share price can create a much larger gain or loss. Investor.gov’s stock overview identifies dividends and capital appreciation as separate reasons for owning stock and emphasizes that prices can fall and investors can lose money.
Yield on cost is another potentially confusing number. If you bought at $20 and the current dividend is $1.20, your yield on the original purchase cost is 6%; at a current $30 price, the stock’s current yield is 4%. Yield on cost can describe your history, but it is not the right ratio for comparing what today’s $30 of capital could earn elsewhere. Use current price for current comparisons.
Investigate a high yield in evidence order
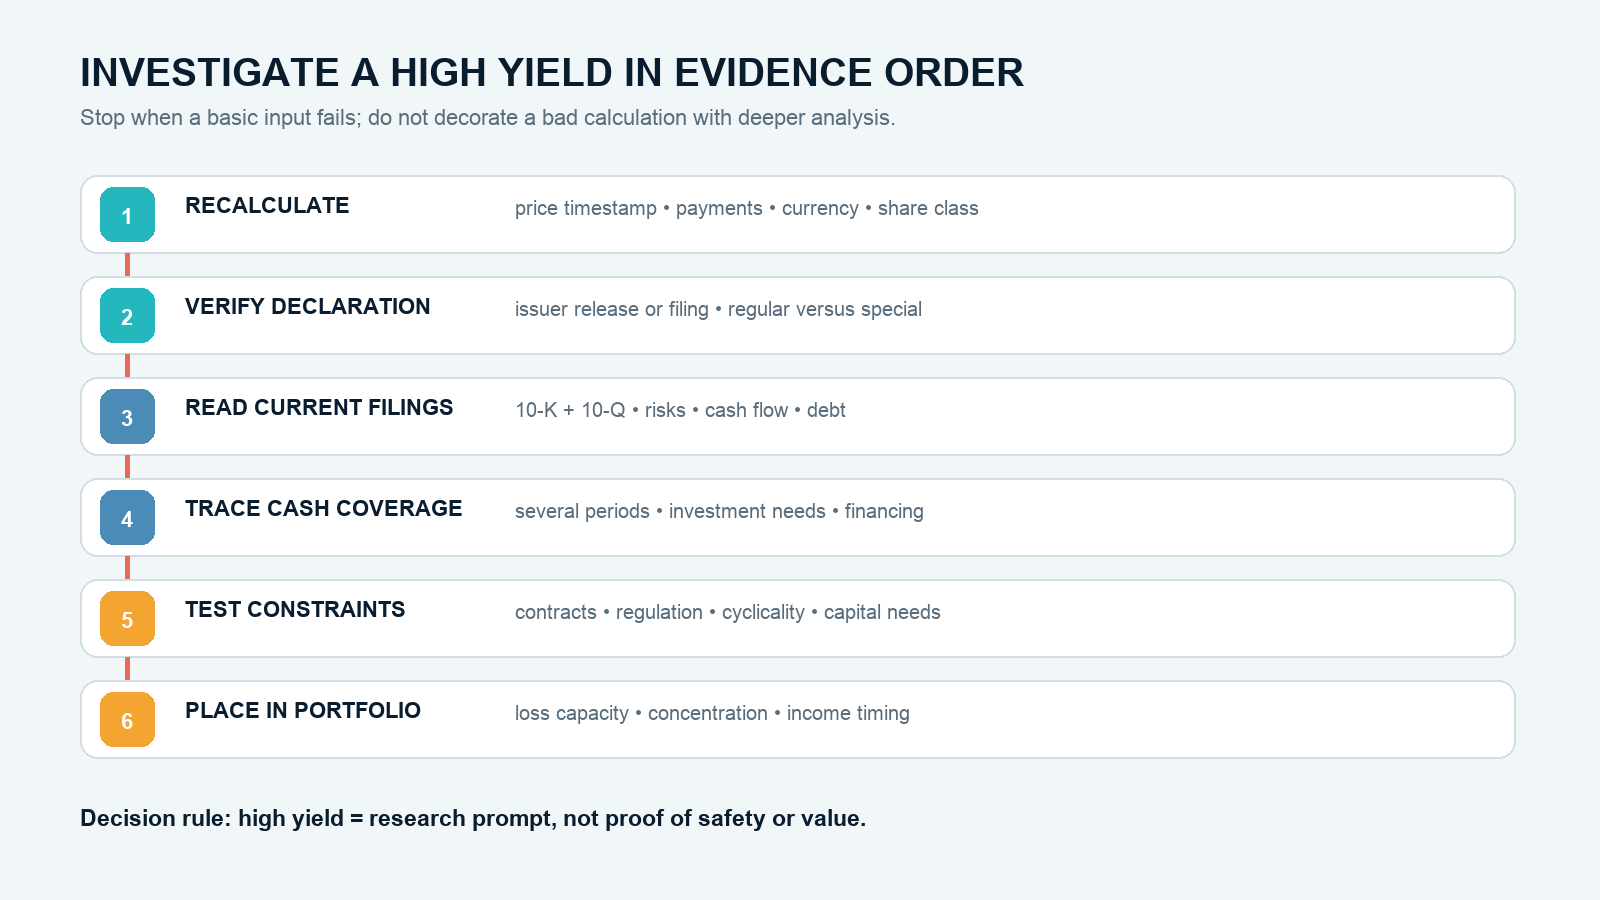
- Recalculate it. Record the current price, each included dividend, currency, share class, payment frequency, and whether a special dividend entered the total.
- Verify the declaration. Find the issuer’s release or regulatory filing. Separate a declared payment from management’s target, analyst estimate, or quote-site projection.
- Read the latest 10-K and 10-Q. Review the business risks, financial statements, cash-flow statement, debt, and management discussion. Investor.gov’s 10-K/10-Q guide identifies those sections and explains that quarterly reports update the annual filing.
- Trace cash coverage over time. Compare dividends paid with operating cash generation, investment needs, financing, and cash balances across several periods. A single payout ratio can be distorted by one-time earnings or sector-specific accounting; explain the metric you use rather than applying a universal cutoff.
- Look for constraints and cyclicality. Debt agreements, capital requirements, regulation, acquisitions, or an unstable revenue base can compete with dividends for cash.
- Place it in the portfolio. Test the loss you could absorb, the concentration created by one issuer or sector, and whether the income timing fits the actual need.
The order matters. There is no value in debating whether a 12% yield is safe if a stale price or one-time distribution produced the 12% in the first place.
Do not confuse related dividend dates and labels
A declaration normally identifies an amount, record date, and payment date. The ex-dividend date governs whether a buyer receives the upcoming payment. According to Investor.gov’s ex-dividend guidance, buying on or after the ex-dividend date generally means the seller receives that dividend. Buying shortly before the date does not manufacture a risk-free profit; eligibility for cash does not eliminate the share-price adjustment or market risk.
Also separate a cash dividend from a stock dividend, and a common-stock dividend from a preferred distribution. Different share classes can have different rights and rates. The ordinary dividend-yield formula remains a ratio, but the instrument’s terms determine which payment belongs in the numerator.
Use a repeatable dividend-yield worksheet
For any stock you review, save this small audit trail:
- Issuer, ticker, exchange, currency, and share class
- Price, source, and timestamp
- Each dividend amount, type, declaration source, and payment date
- Chosen basis: trailing regular, trailing total, or indicated regular
- Annual dividend per share and reproduced yield calculation
- Alternative result excluding special or irregular payments
- Base, cut, and suspension income scenarios for your share count
- Links to the latest 10-K, 10-Q, and relevant 8-K or issuer release
The decision rule is: use dividend yield only after you can reproduce it and name its basis. Then treat the result as one input beside business quality, financial condition, valuation, total-return risk, diversification, taxes, and your own time horizon. A high percentage earns more investigation; it does not earn automatic trust.